Download our customizable Business Report Presentation Template to present a business report in a Slide Docs presentation. Nancy Duarte presents the concept of Slide Docs, a report-ready, skimmable document often used as a pre-read or leave-behind. The Slide docs are designed to help an audience comprehend data at their own pace without a presenter. They contain information in easily digestible blocks with a clear visual hierarchy. This best PPT template is useful for project managers to present a compelling business report in annual or quarterly presentations.
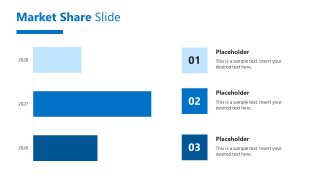
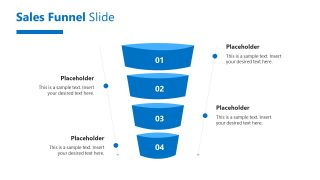
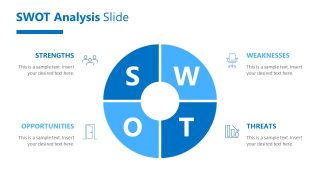
The Business Report Presentation Template features a professional, modern layout for visualizing KPIs, metrics, analyses, and other components of business reports. The blue-and-white color scheme lets strategy consultants outline their viewpoints with clarity and focus. A business report presentation layout enables project managers to use infographics and diagrams to showcase concepts effectively in executive presentations. The grey-toned images used in the layout make the text more prominent and catchy for the audience. Furthermore, strategy directors use the SWOT analysis diagram to outline the company’s internal and external strengths, weaknesses, opportunities, and threats. The 3D segmented funnel allows marketers to showcase the customer journey process in team meetings. A bar chart showing the market share slide is useful for presenting the company’s position and expected revenue growth in the industry.
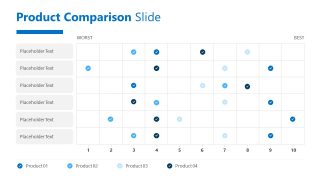
Business analysts use the cover and agenda slides to begin the presentation, then explain the company’s mission, vision, and objectives. Next, multiple slides with placeholder text allow the strategy consultants to outline steps for business development or ways to mitigate risks. For example, product team leads use the grid diagram to compare multiple variants or competitors. Download the customizable business report PPT template for your investor presentations to clearly document your journey and future plans. Additionally, we offer other versions of business report templates, so you can select the one that matches your theme.
What’s inside this template
Example presentation scenarios
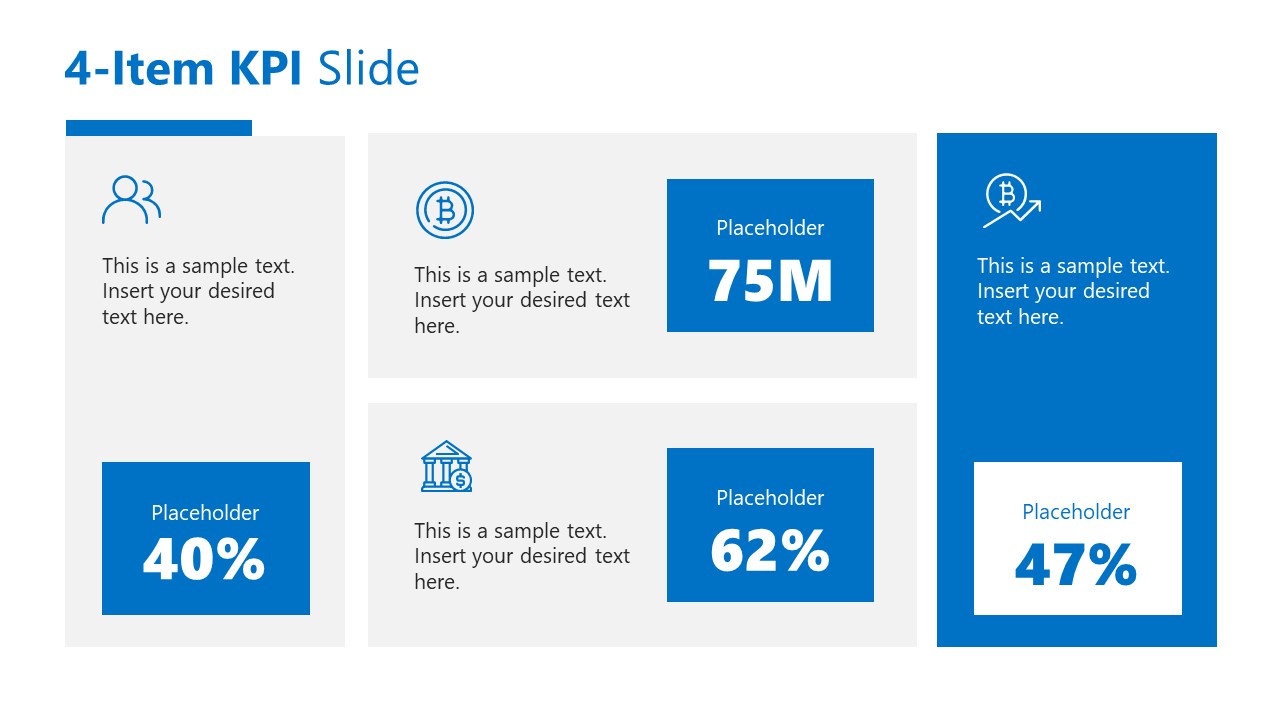
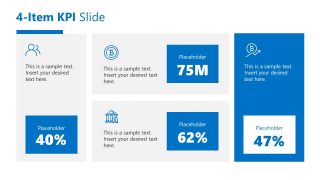
- A project manager can use the agenda, KPI slide, and market share bar chart to report quarterly progress to executives and keep the discussion tied to measurable results.
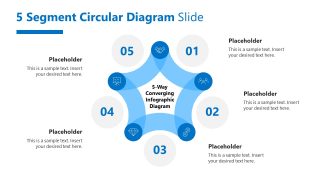
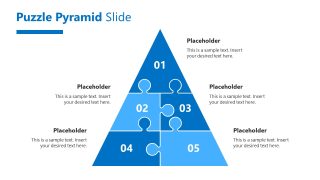
- A strategy consultant can use the SWOT analysis, 5 segment circular diagram, and puzzle pyramid to explain business issues, strategic options, and recommended action areas.
- A marketing manager can use the sales funnel and product comparison matrix to discuss customer journey performance, competitive positioning, and portfolio tradeoffs with a leadership team.
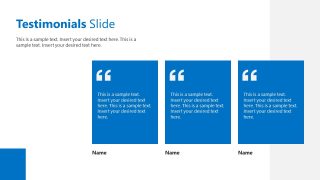
- A business analyst can use the slide-doc content pages, testimonials slide, and contact slide to prepare a pre-read or leave-behind for stakeholders who need to review findings independently.
Features
- 100% editable presentation template
- Compatible with Microsoft PowerPoint
- 16:9 aspect ratio slides
- Scalable vector shapes, icons and illustrations
- AI-Ready for Microsoft Copilot and Claude
- Instant access and download
Frequently asked questions
Q: How should a presenter structure the report so the audience does not get lost in the amount of information?
A: Start with the cover and agenda, then group the text-heavy slides around a small number of business questions. Use the KPI slide and market share bar chart as evidence before moving into SWOT, funnel, and comparison slides. This order lets the audience see the issue, understand the data, and follow the analysis.
Q: Who is this template best suited for in a business reporting setting?
A: It fits project managers, business analysts, consultants, and department leaders who need to document progress, decisions, and business context for executives or stakeholders. The slide-doc style works well when the deck may be read without a live presenter, because the pages include headers, short paragraphs, images, metrics, and callouts.
Q: Why do the funnel, SWOT circle, and puzzle pyramid improve the report instead of using only text slides?
A: Those diagrams turn abstract business findings into recognizable structures. The funnel shows staged movement, the SWOT circle separates internal and external factors, and the puzzle pyramid suggests connected building blocks. Used after the KPI and market share slides, they help the audience interpret what the numbers mean.









Business Report Presentation Template
19-slide business report presentation template with KPI dashboard, SWOT analysis, and funnel layouts
Business Report Presentation Template is a 19-slide PowerPoint deck for business, project, and progress reporting. It includes a cover, agenda, KPI dashboard, market share bar chart, sales funnel, circular diagram, SWOT analysis, puzzle pyramid, product comparison matrix, testimonials, and contact slide in 16:9 format.
- Category
- Business PowerPoint Templates
- Rating

 Loading...
- Aspect ratio
- 16:9
- Item ID
- 23253-01
- Colors
 Microsoft PowerPoint
  Microsoft Copilot
  Claude for PowerPoint
 Other formats supported
Subscribe today and get immediate
access to download our PowerPoint templates.