Slide 5 of 13 from Operational Report PowerPoint Template
Operational KPIs Dashboard Slide – Operational Report PPT Template
Operational KPI Dashboard Slide
- Chart
- Dashboard Composite
- Kpi Reporting Slide
- 16:9
- 100% Editable
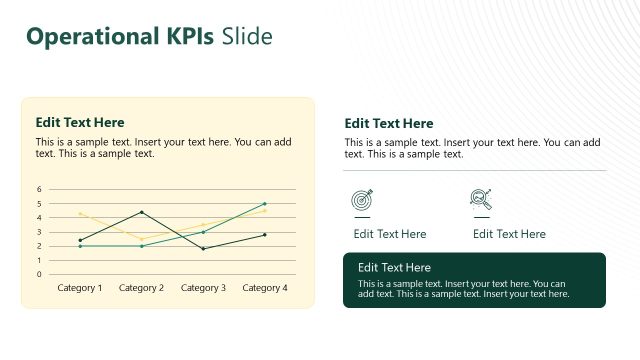
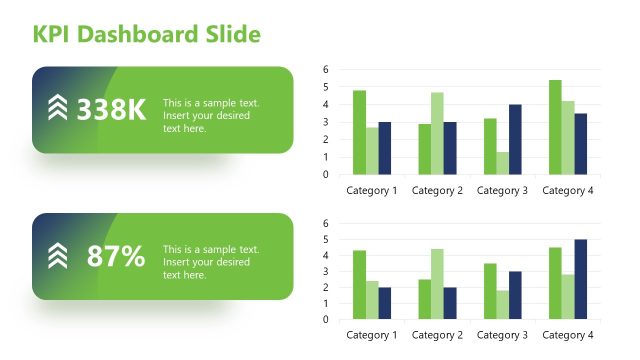
The Operational KPI Dashboard slide from the Operational Report PowerPoint Template offers a structured layout for presenting key performance indicators with charts and metrics. This slide template is suitable for business presentations focused on quarterly reviews and operational efficiency, featuring editable shapes and vector icons to enhance clarity in corporate presentations and strategic planning discussions.
What’s on This Slide
The slide features a KPI dashboard layout with multiple sections. At the top left, a blue box contains two text placeholders for key metrics. Below it, another dark box presents additional metrics with corresponding placeholders. The main area displays a bar chart comparing three series across four quarters, with a line chart below it showing trends over four months. On the right, two smaller boxes contain placeholders for additional metrics and a circular gauge. The overall layout is structured for clarity, with visual hierarchy emphasizing the charts.
How to Use It
This layout serves as a KPI dashboard, ideal for presenting operational performance metrics. It fits into a presentation sequence following an overview or summary slide, providing detailed insights into performance trends. This format is useful in business scenarios such as quarterly performance reviews, operational efficiency assessments, and strategic planning discussions. It allows for a clear comparison of key indicators over time, facilitating informed decision-making.
Text Placeholders & Capacity
Keep your copy within these limits so it fits without resizing. Body slots are tight, roughly 4 words each.
| Placeholder | Count | Max characters (approx.) |
|---|---|---|
| Slide title | 1 | 30 |
| Body paragraph | 4 | 20 |
| Item heading | 5 | 10 |
| Chart title | 1 | 30 |
Slide Keywords
Download unlimited PowerPoint templates, charts and graphics for your presentations with our annual plan.
DOWNLOADReturn to Operational Report PowerPoint Template.