Slide 9 of 13 from Operational Report PowerPoint Template
Quality Performance Slide with Data Charts
Quality Performance Slide for Operational Reports
- Chart
- Combo Chart
- Performance Slide
- 16:9
- 100% Editable
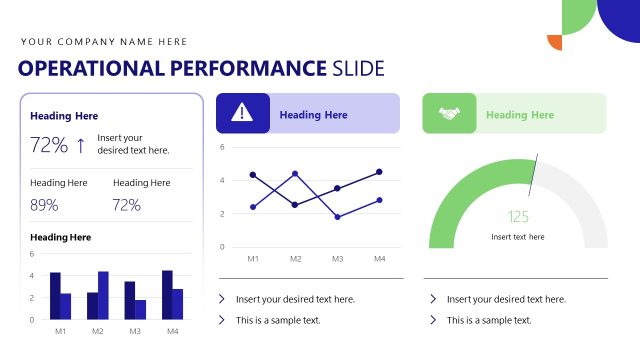
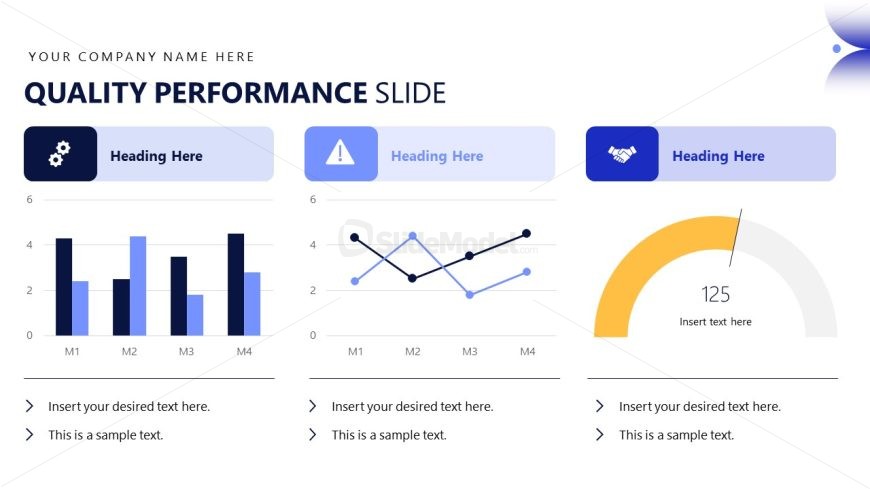
The Quality Performance Slide from the Operational Report PowerPoint Template offers a clear layout for presenting key metrics through bar, line, and gauge charts. This slide template is ideal for business presentation contexts such as performance reviews and strategy meetings, providing editable slides with vector icons to effectively communicate operational assessments and quality indicators within a corporate presentation or slide deck.
What’s on This Slide
The layout features three distinct sections arranged horizontally. The left section contains a bar chart with four bars representing metrics labeled M1 to M4, accompanied by a gear icon and a heading placeholder above. The middle section displays a line chart with four data points, an alert icon, and another heading placeholder. The right section includes a circular gauge with a numerical placeholder, a handshake icon, and a heading placeholder. Below each section are text placeholders for additional information, aligned left. The overall color scheme includes shades of blue and gray.
How to Use It
This layout serves as a performance overview, showcasing metrics and insights. It fits well in a presentation sequence after operational challenges and before improvement initiatives. Suitable for business contexts such as performance reviews, operational assessments, and strategy meetings, it effectively communicates data-driven insights and quality metrics to stakeholders. The structure allows for clear comparisons and highlights critical performance indicators.
Text Placeholders & Capacity
Keep your copy within these limits so it fits without resizing. Text slots are moderate, roughly 10-15 words each.
| Placeholder | Count | Max characters (approx.) |
|---|---|---|
| Slide title | 1 | 30 |
| Item heading | 3 | 20 |
| Item body | 3 | 50 |
| Chart title | 2 | 20 |
| Kpi value | 1 | 10 |
Slide Keywords
Download unlimited PowerPoint templates, charts and graphics for your presentations with our annual plan.
DOWNLOADReturn to Operational Report PowerPoint Template.