Slide 8 of 13 from Operational Report PowerPoint Template
Resource Utilization Diagram Slide – Operational Report Template
Resource Utilization Metrics Slide
- Chart
- Other
- Performance Review Slide
- 16:9
- 100% Editable
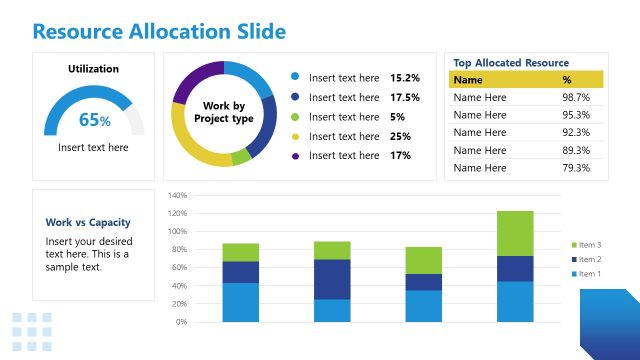
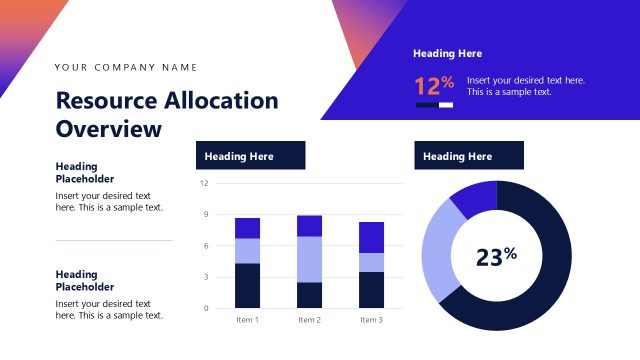
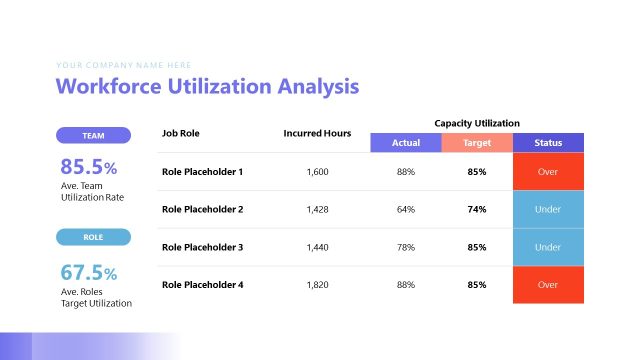
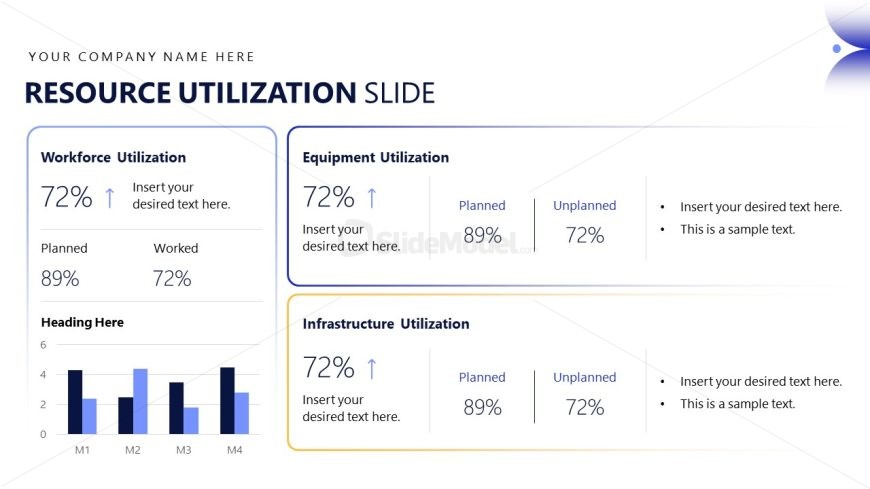
The Resource Utilization Metrics slide from the Operational Report PowerPoint Template offers a structured layout to display workforce, equipment, and infrastructure efficiency. This slide template includes editable shapes and a bar chart to visualize utilization percentages and planned versus worked values, making it suitable for business presentations focused on operational performance reviews and resource allocation analysis.
What’s on This Slide
The layout features three distinct sections for Workforce, Equipment, and Infrastructure Utilization, arranged in a vertical format. Each section contains a title at the top, followed by a percentage utilization figure prominently displayed. Below the percentage, there are placeholders for planned and worked values, with the latter aligned to the right. A bar chart is included in the Workforce section, illustrating data across four categories labeled M1 to M4. Text placeholders are present for additional insights and commentary, positioned beneath each utilization metric. The overall design employs a clean, structured approach with a light background and bold headings.
How to Use It
This layout serves to present resource utilization metrics in a clear, comparative format, suitable for operational reviews. It fits well after performance overview slides, providing detailed insights into workforce, equipment, and infrastructure efficiency. This structure is ideal for business scenarios where stakeholders need to assess resource allocation and identify areas for improvement. It can be used in quarterly reviews, operational strategy meetings, or performance assessments to communicate key utilization statistics effectively.
Text Placeholders & Capacity
Keep your copy within these limits so it fits without resizing. Body slots can accommodate roughly 15-20 words each.
| Placeholder | Count | Max characters (approx.) |
|---|---|---|
| Slide title | 1 | 30 |
| Item heading | 3 | 20 |
| Item body | 3 | 50 |
| Chart title | 1 | 20 |
| Body paragraph | 6 | 100 |
Slide Keywords
Download unlimited PowerPoint templates, charts and graphics for your presentations with our annual plan.
DOWNLOADReturn to Operational Report PowerPoint Template.