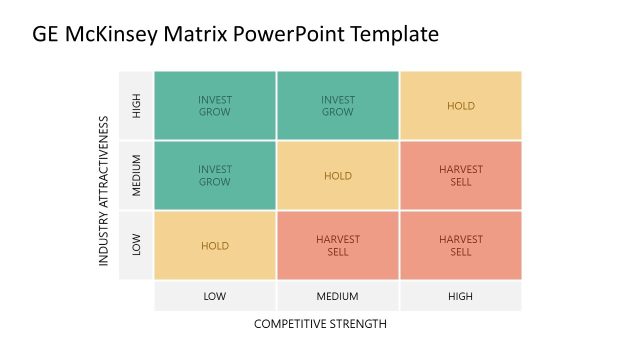
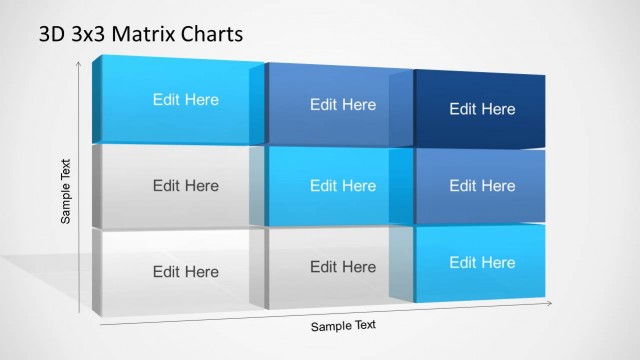
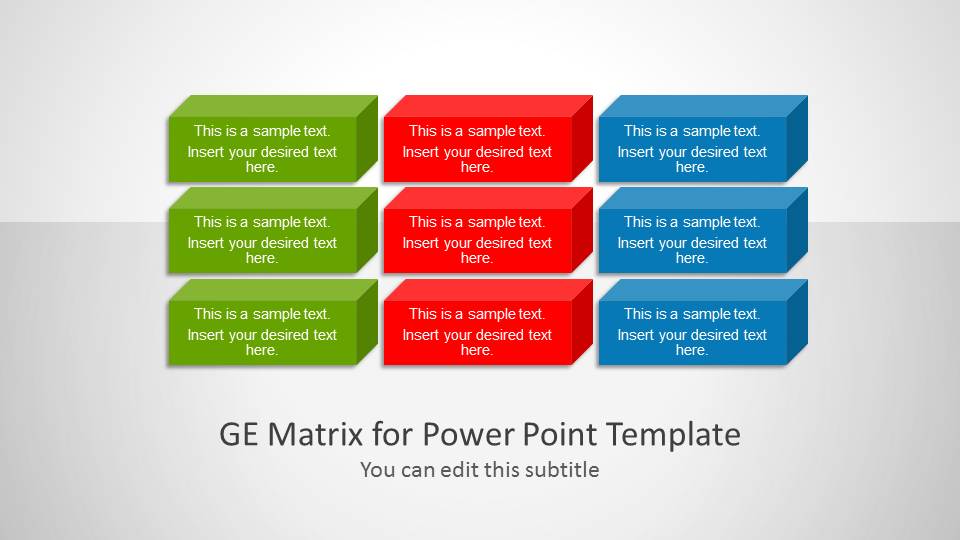
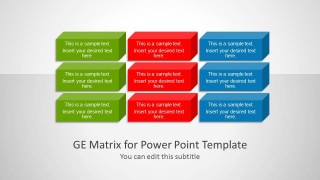
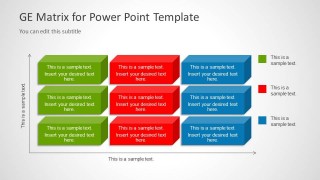
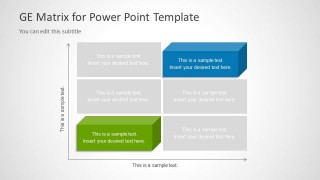
GE Matrix for PowerPoint contains all you need to model a McKinsey GE Matrix presentation slide. This presentation template for Microsoft PowerPoint contains multiple slides with 3D matrix design that you can use for different purposes and design the GE Matrix model in consulting presentations which was based on the works by McKinsey with General Electric with a tool for screening GE’s large portfolio of strategic business units.
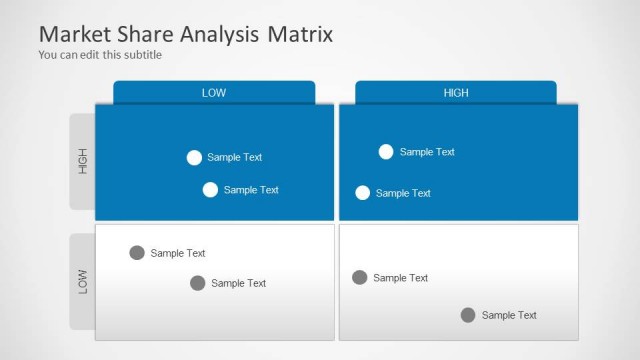
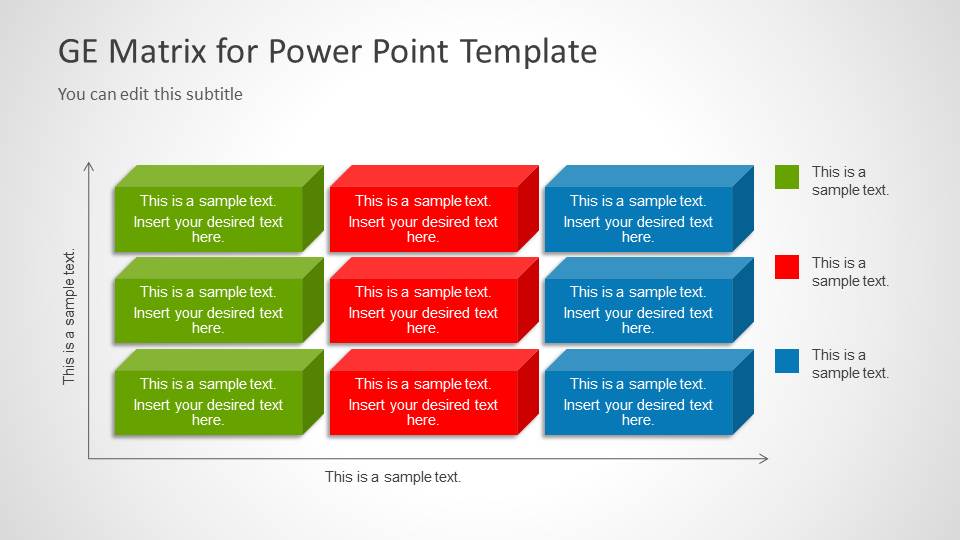
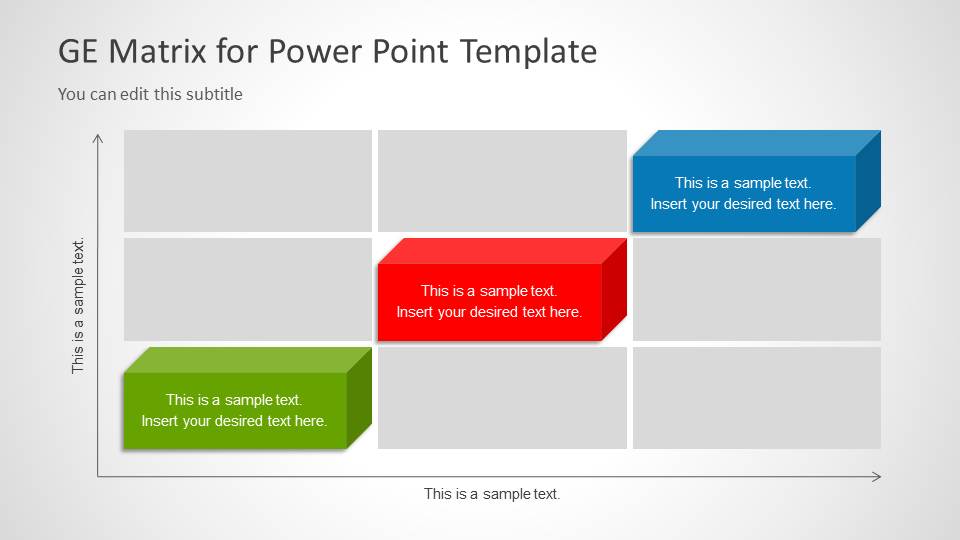
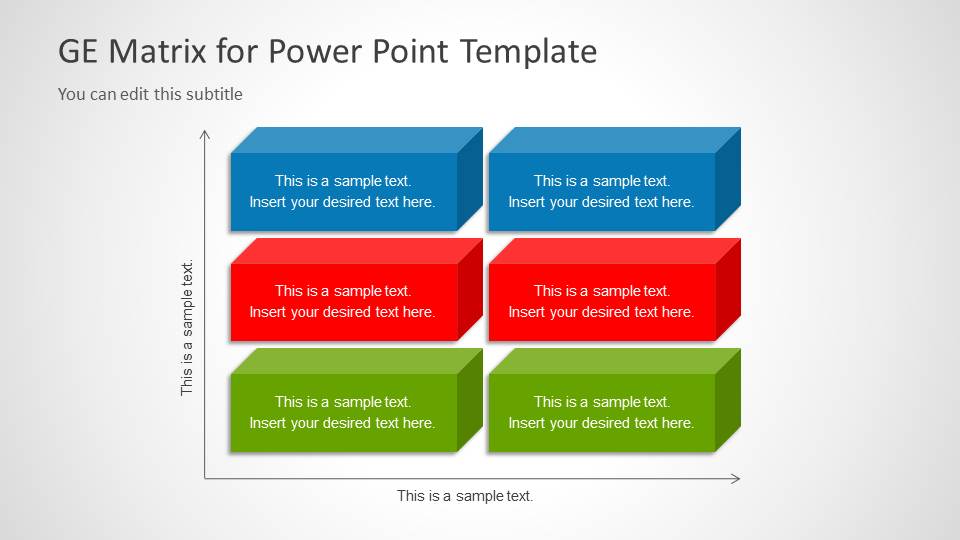
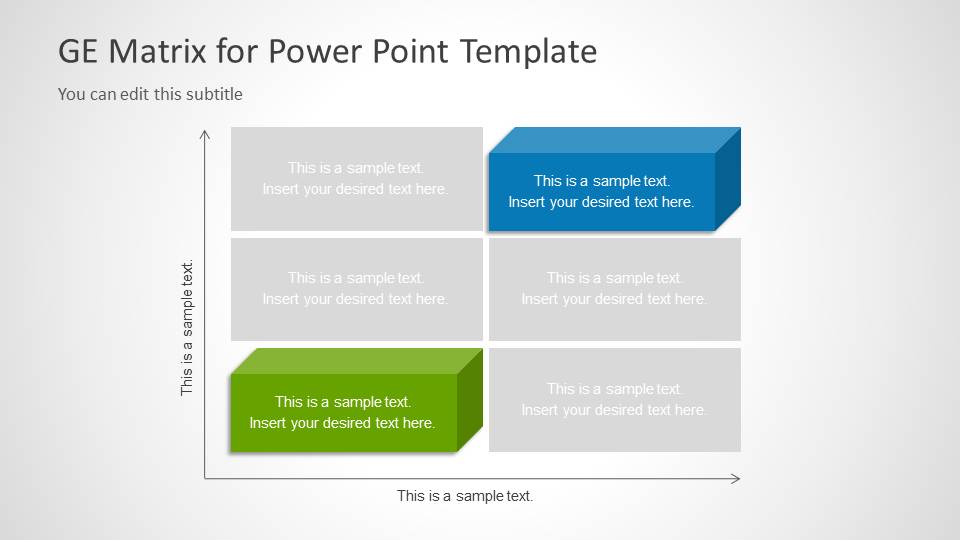
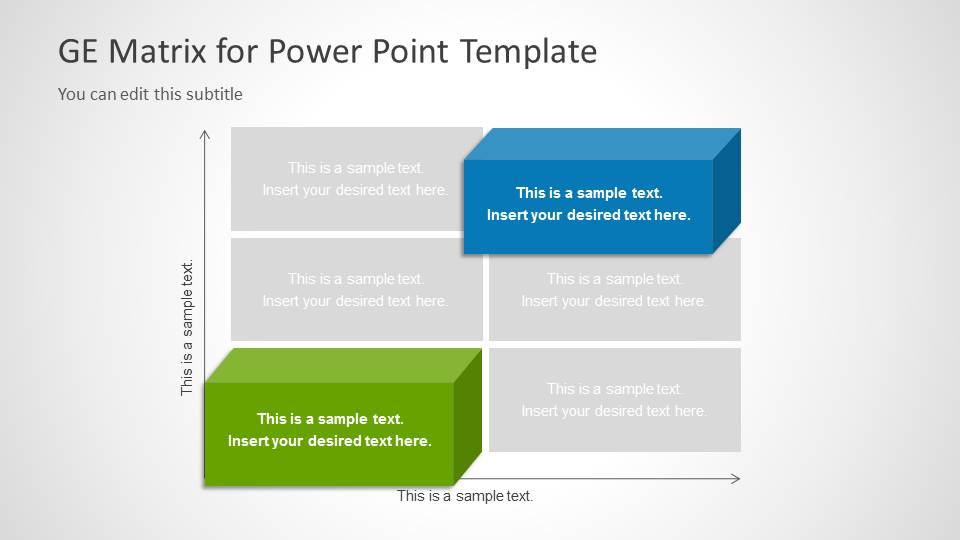
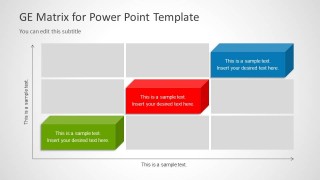
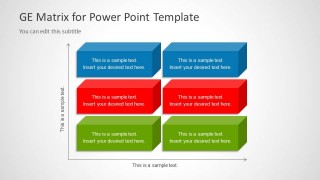
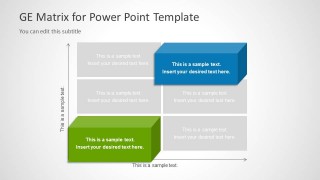
Inside this template you can find different matrix designs for PowerPoint including McKinsey’s 9 box matrix style, 6 box matrix, as well as other matrix designs with some matrix cells highlighted so you can empathize and focus on certain cells during your slideshow. All the slides and text boxes are editable.
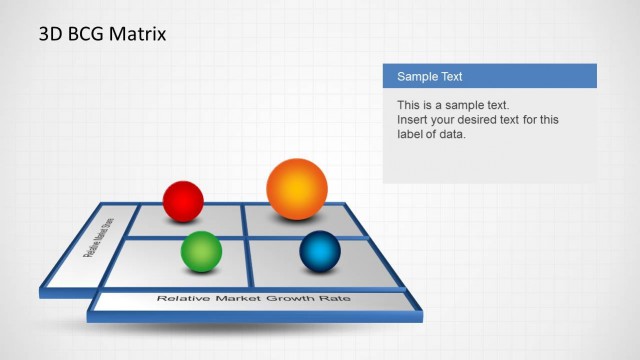
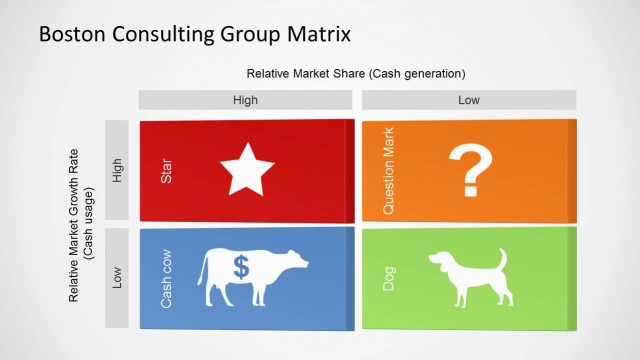
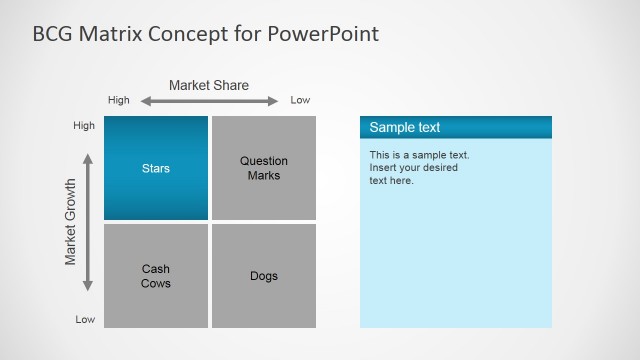
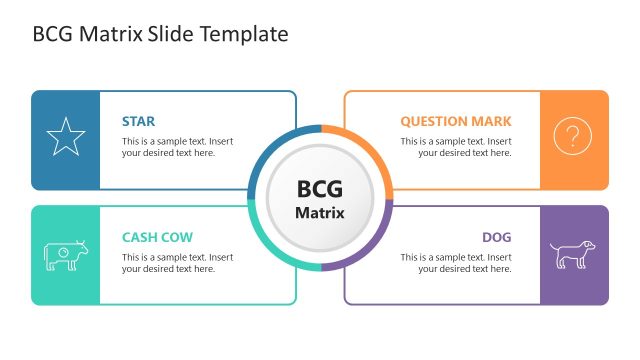
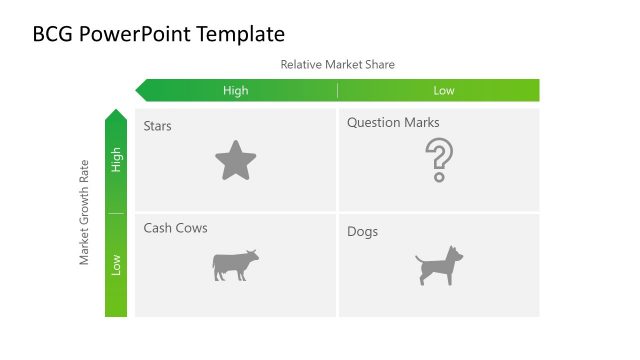
Alternatively you can download the BCG growth share matrix for PowerPoint.
What’s inside this template
Example presentation scenarios
- A management consultant can use the 3x3 GE Matrix to compare business units by market attractiveness and competitive strength during an executive strategy recommendation.
- A corporate strategy manager can use the highlighted 9-box grid to show which portfolio areas deserve investment, monitoring, or exit discussion in a leadership review.
- A portfolio manager can use the 6-cell matrix to simplify a complex business unit discussion when the audience needs fewer categories than a full 9-box model.
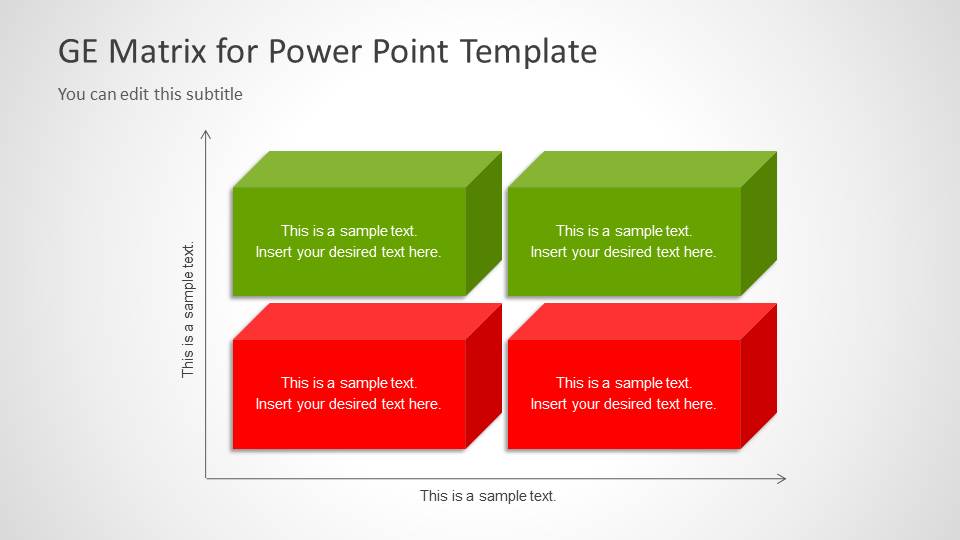
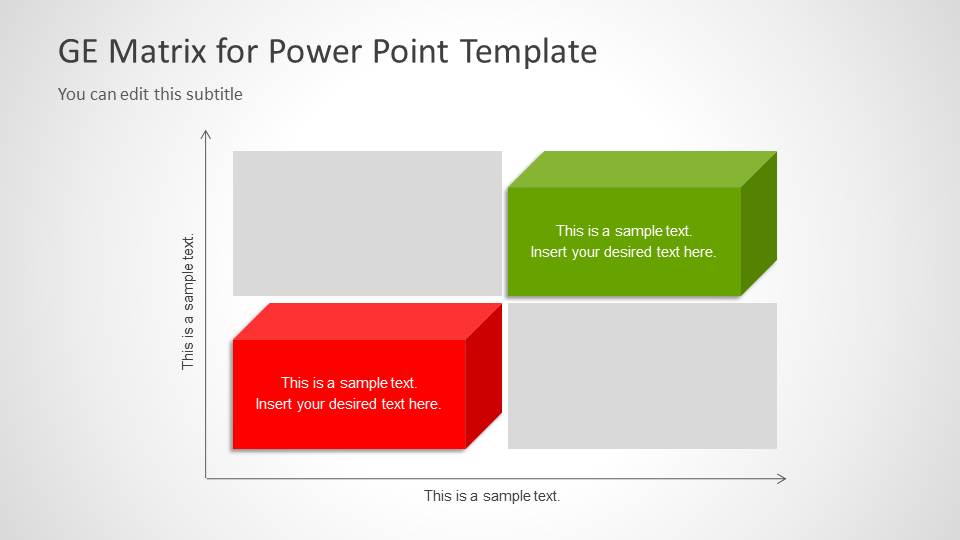
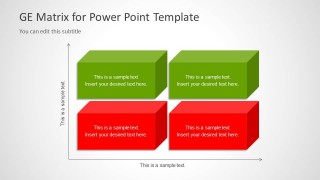
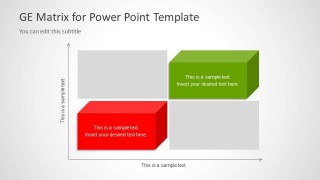
- A business school instructor can use the 2x2 and 3x3 matrix slides to teach how strategic position changes when different criteria are placed on the axes.
Features
- 100% editable presentation template
- Compatible with Microsoft PowerPoint and Google Slides
- Scalable vector shapes, icons and illustrations
- AI-Ready for Microsoft Copilot and Claude
- Instant access and download
Frequently asked questions
Q: How should a presenter explain the GE Matrix without overloading the audience?
A: Start with the full 3x3 matrix to define the two axes and the meaning of the color groups. Then move to a highlighted-cell slide to focus discussion on one or two strategic positions. Keep each cell label short, and reserve detailed evidence for speaker notes or supporting slides outside this diagram.
Q: Who is this template best suited for in a strategy discussion?
A: This template fits consultants, strategy teams, and portfolio leaders who must compare business units or product lines using a shared decision frame. It is most useful when the audience needs to understand relative position, investment priority, or screening logic, rather than review detailed financial performance line by line.
Q: Why do the raised 3D blocks and highlighted cells help the message?
A: The raised block metaphor makes selected cells feel like active choices instead of flat table entries. Gray background cells keep the full matrix context visible, while green, red, and blue blocks direct attention to priority zones. This helps executives see both the framework and the recommendation path quickly.
GE Matrix for PowerPoint
8-slide presentation template with 3D GE Matrix, 9-box portfolio analysis, and highlighted priority cells
GE Matrix for PowerPoint is an 8-slide PowerPoint template for portfolio screening and strategic business unit comparison. The deck shows 3D 9-box GE matrices, 6-cell matrices, 2x2 prioritization grids, axis labels, legends, and highlighted investment cells for consultants, strategy teams, and business managers.
- Category
- Business PowerPoint Templates
- Rating


 Loading...
- Item ID
- 6011-01
- Colors
 Microsoft PowerPoint
  Microsoft Copilot
  Claude for PowerPoint
 Other formats supported
Subscribe today and get immediate
access to download our PowerPoint templates.