BCG Growth-share Matrix PowerPoint Template
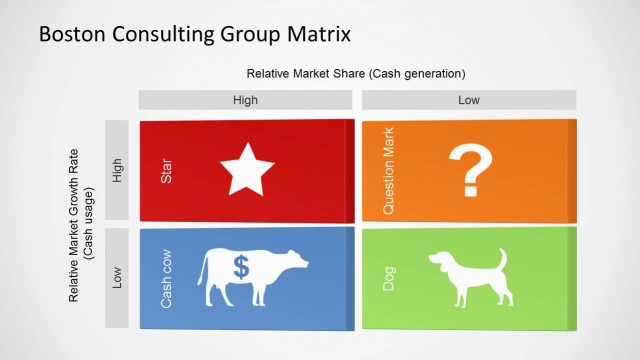
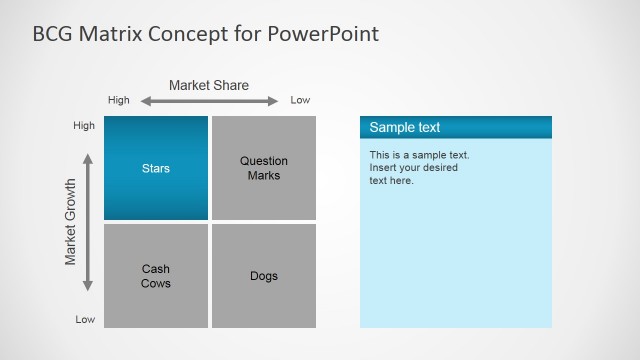
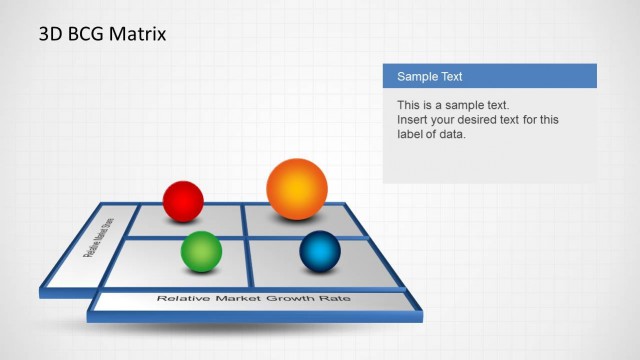
The BCG Growth-share Matrix PowerPoint Template is an editable diagram presentation for BCG Matrix. This is an analysis tool designed by Boston Consulting Group (BCG) for businesses, products, or brands. The purpose of BCG matrix framework is to evaluate the strategic position of business brand portfolio and it’s potential. It classifies portfolio into four 4 categories to evaluate which brand to invest in. These categories are based on growth analysis and competitive position of business, measured at growth rate and market share.
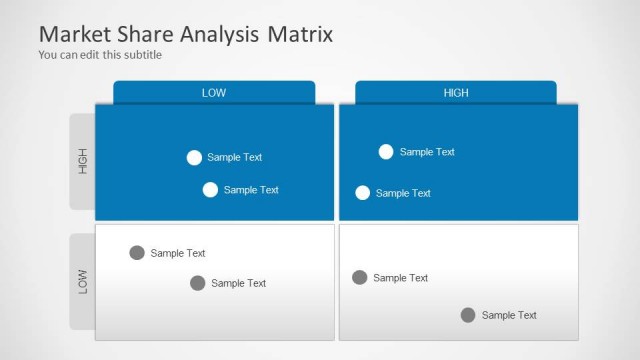
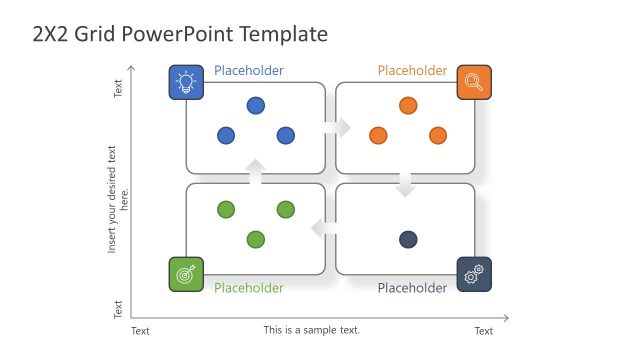
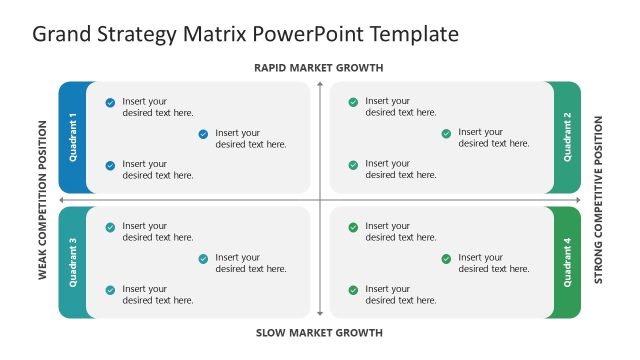
The 2X2 matrix diagram helps allocate resources and use as analytical tools for strategies, management, marketing, etc. As a corporate planning tool, the matrix template is used to display organization’s brand portfolio. 4 PowerPoint slides of BCG growth-share matrix present four diagram variations of framework. Business professionals can take advantage of these slides to make creative strategic planning and investment portfolio presentations.
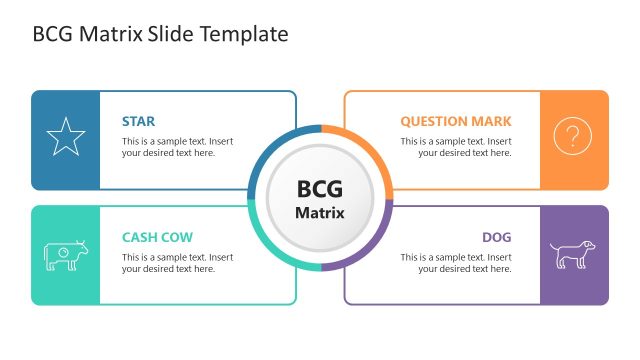
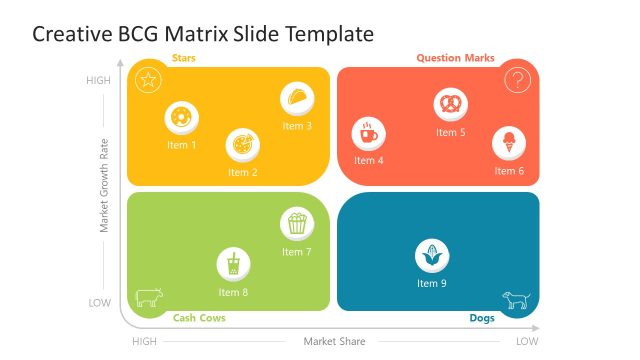
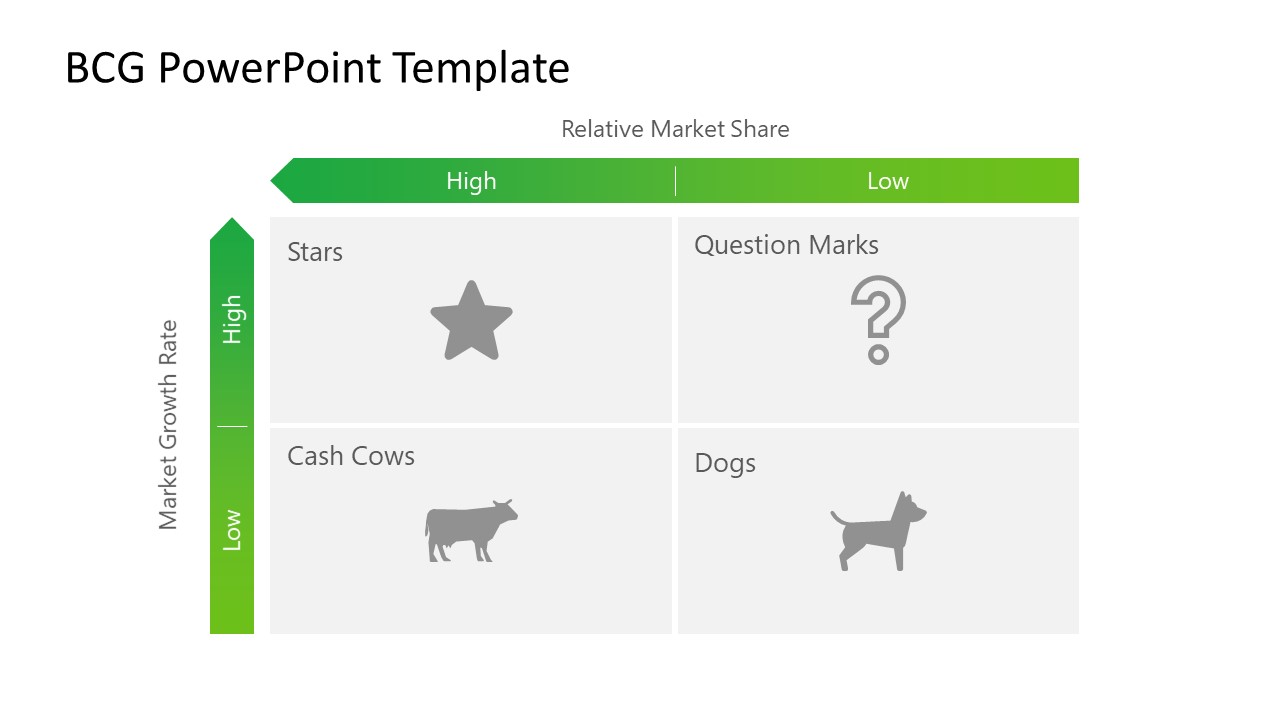
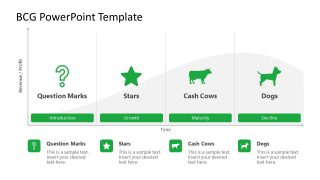
The four quadrants of BCG matrix are classified as Star, Dogs, Cow, and Question mark. Stars are products or services that grow the fastest and have highest margin i.e. high-growth industry with high market-share. These are the main focus of investment. Dogs are the products that do not grow and no longer important from competitors perspective. Such product portfolio drain resources. Cow (cash flow) involves a portfolio of the most profitable brands. Use BCG matrix to optimize profit from it. Lastly, Question marks have the potential to become large but have a small market share. The business will have to choose if these are dogs or cow.
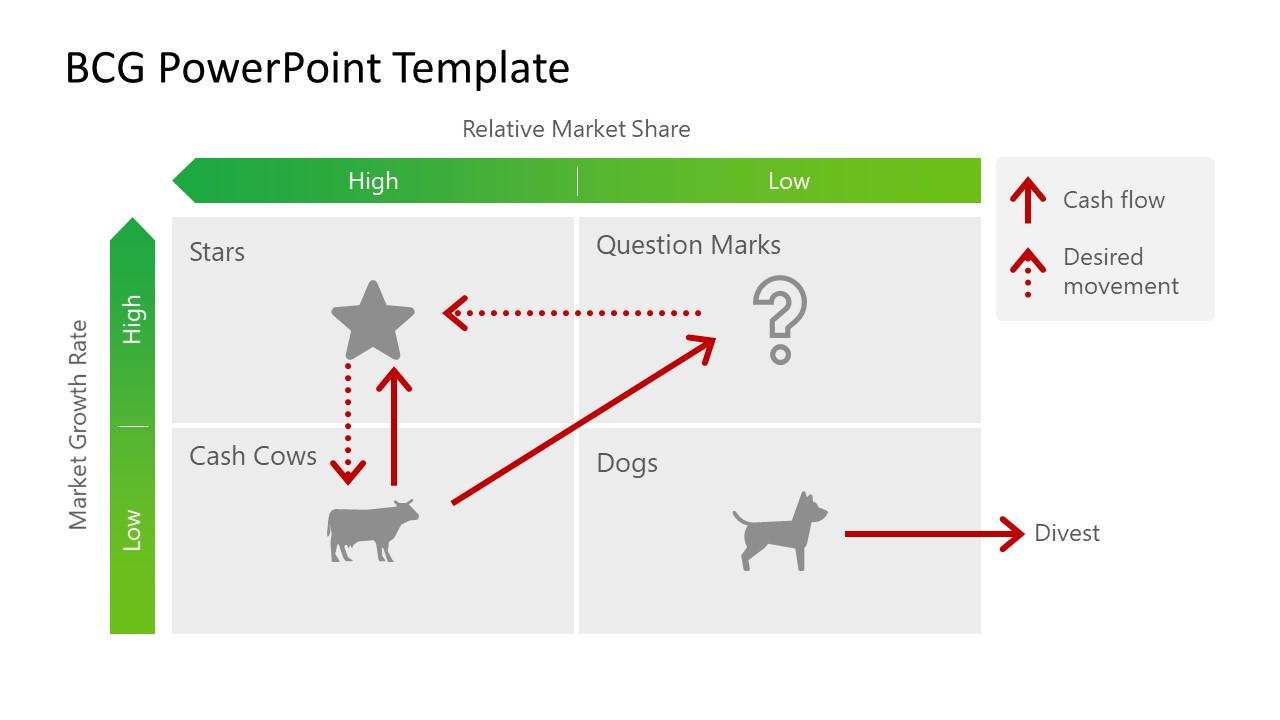
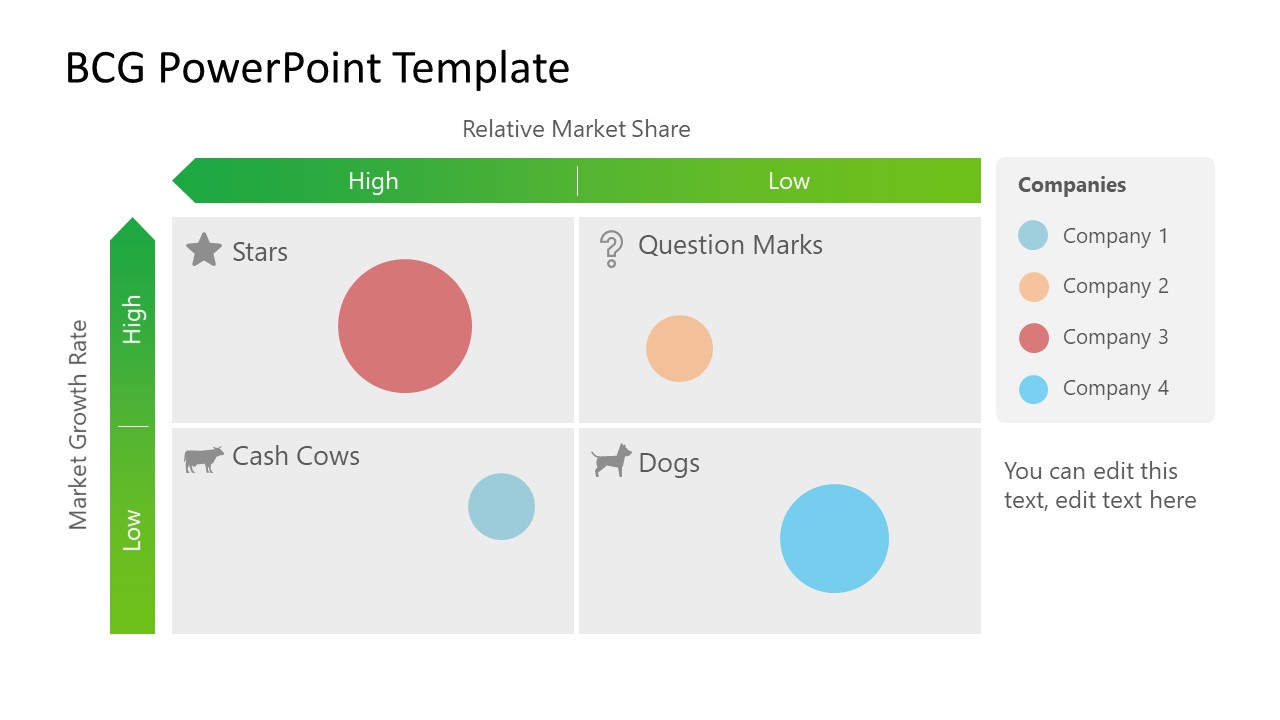
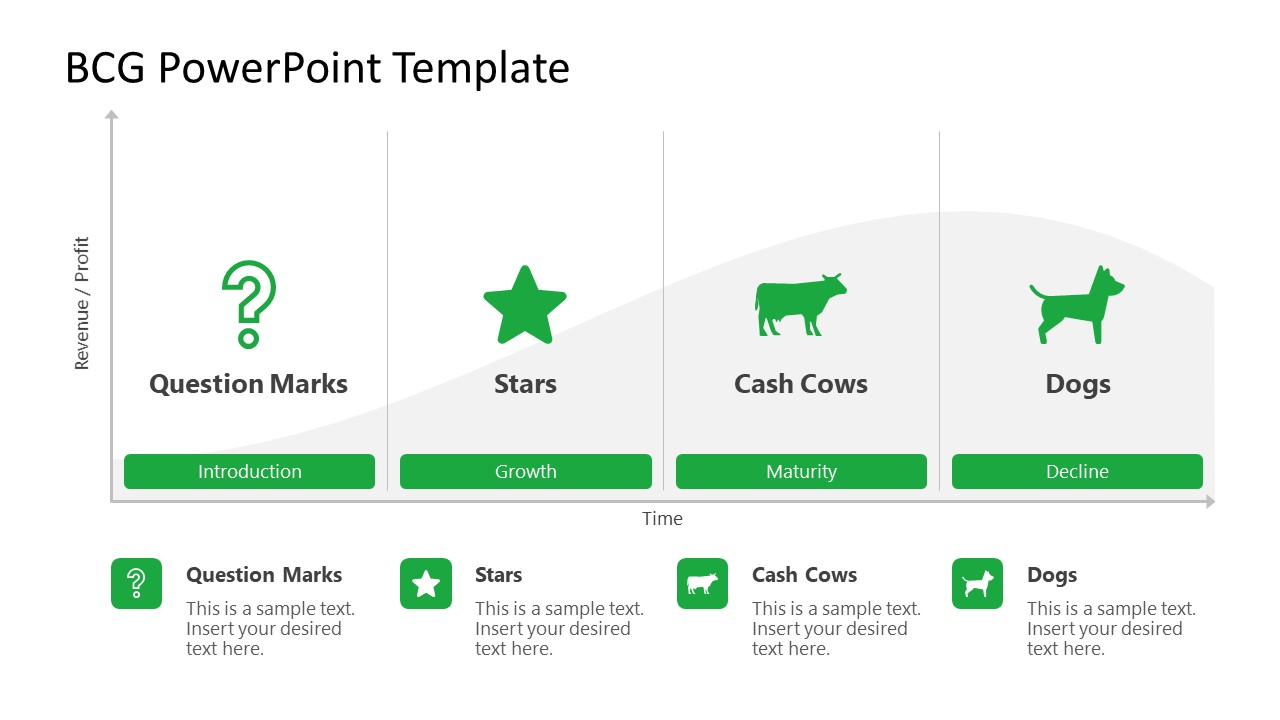
BCG Growth-share Matrix PowerPoint Template displays star, dog, cow, and question mark clipart as metaphors in each quadrant. Three slides of 2X2 matrix layout use additional clipart icons to discuss different aspects of brand portfolio. For example, the arrow shapes to display cash flow and desired movements or circles for market size. BCG model template also provides a graph for growth matrix repositioning through product lifecycle.
The slides of growth-share matrix PowerPoint can help demonstrate business strategy or marketing plans. Likewise, you can add these slides as a part of M&A investors’ decks or other corporate presentations. For instance, use BCG growth-share matrix to create a digital marketing strategy for eCommerce business.


You must be logged in to download this file.
DOWNLOAD- Category
- Models
- Rating

 Loading...
- Size
- 16x9
- Item ID
- 20625-01
- Colors
Subscribe today and get immediate
access to download our PowerPoint templates.