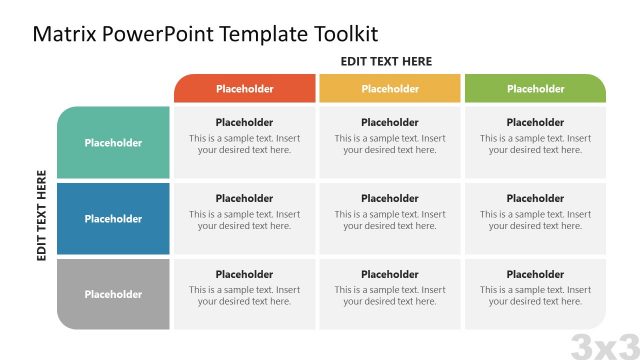
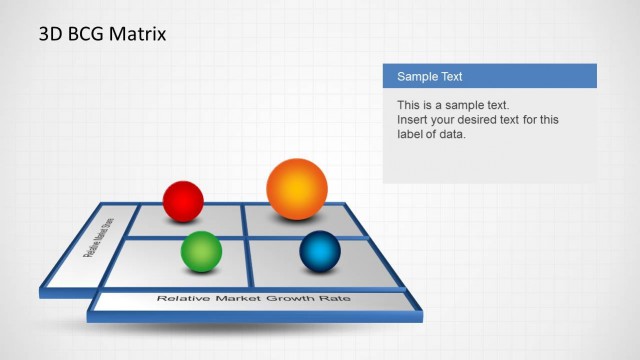
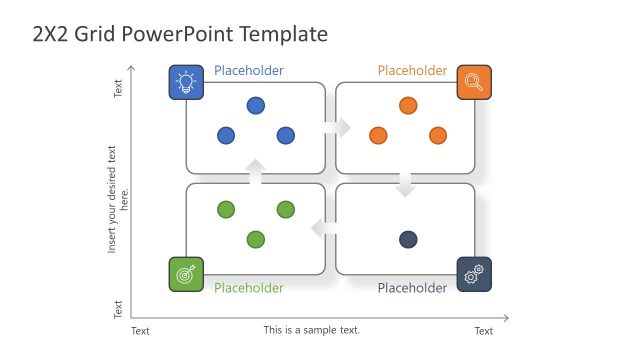
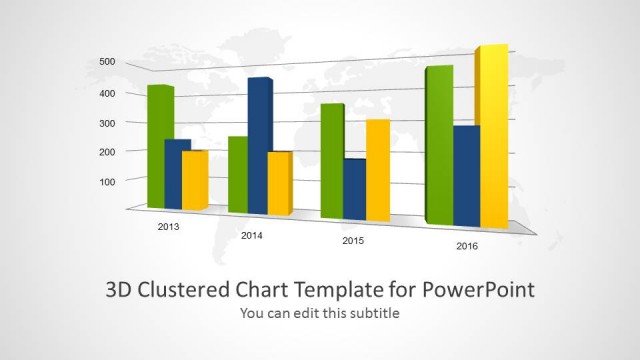
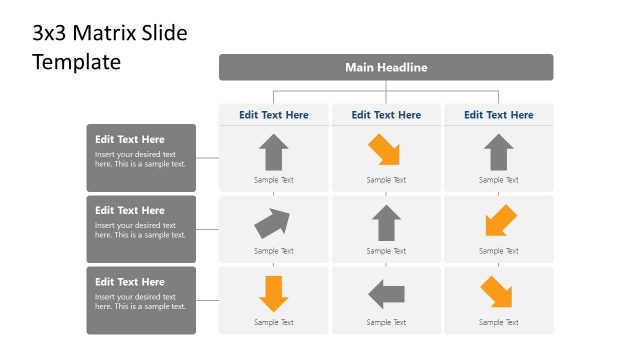
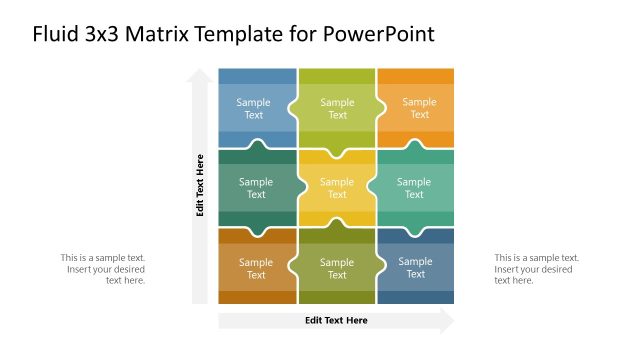
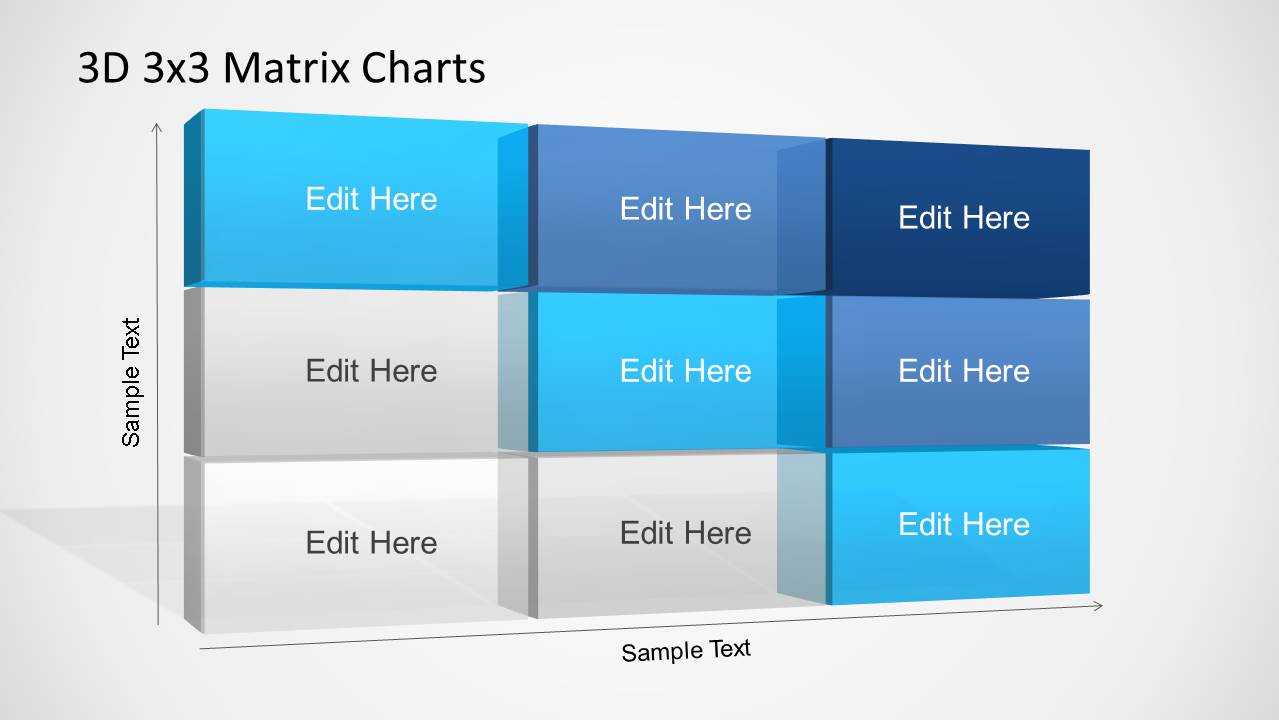
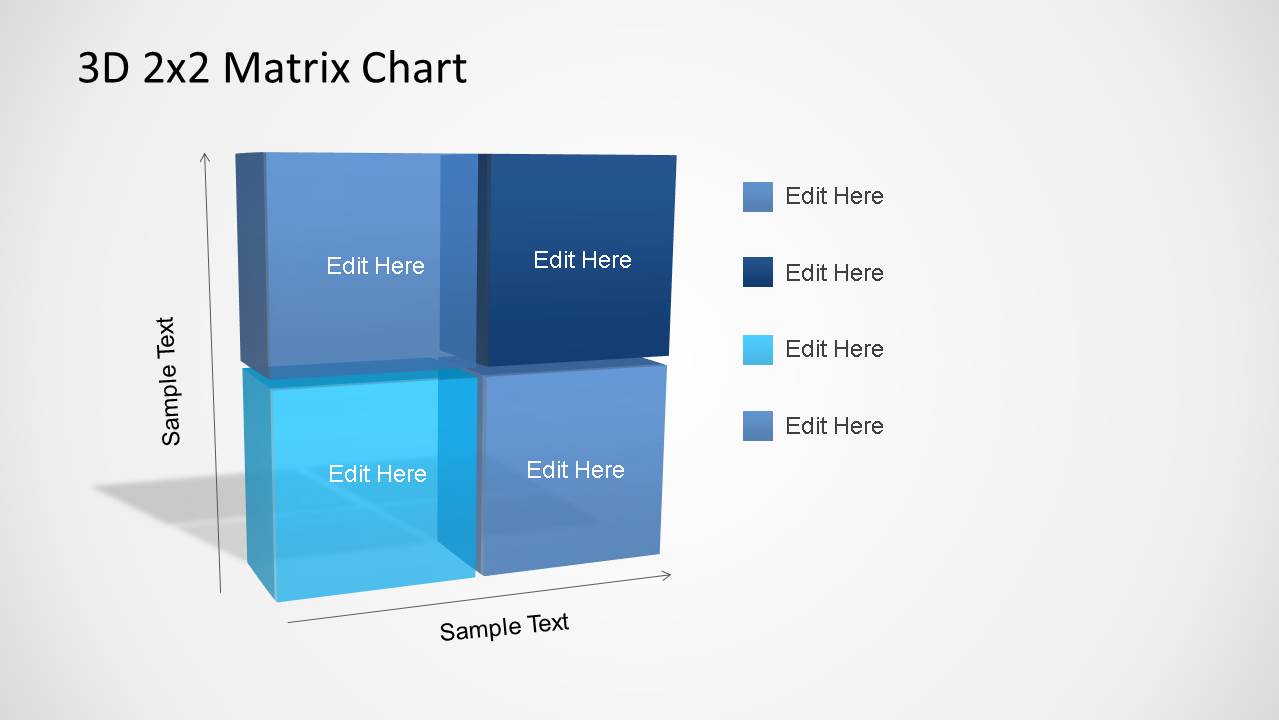
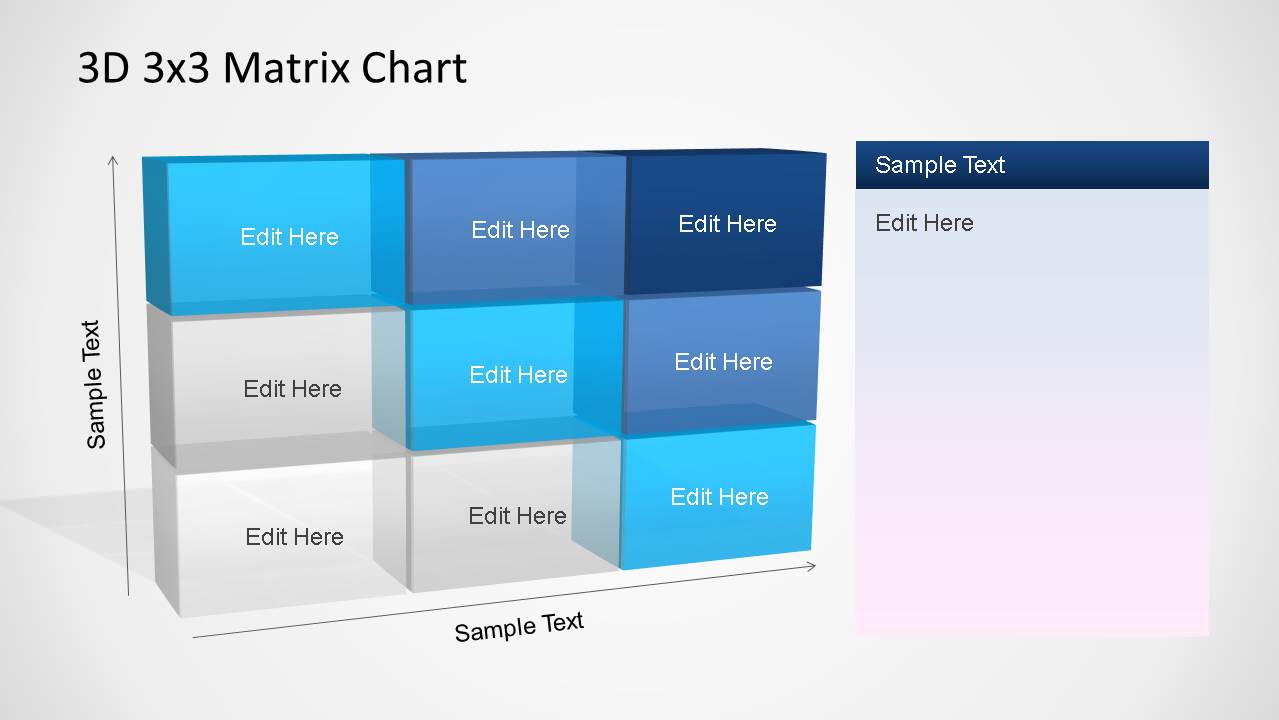
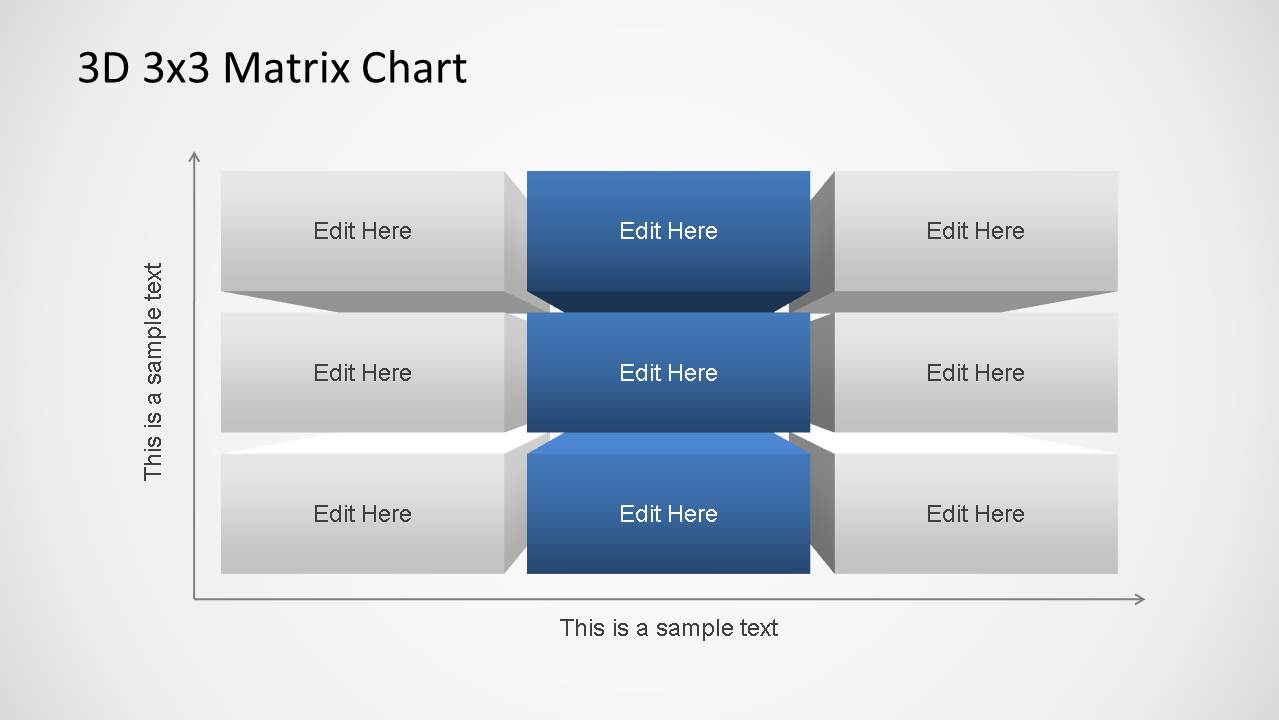
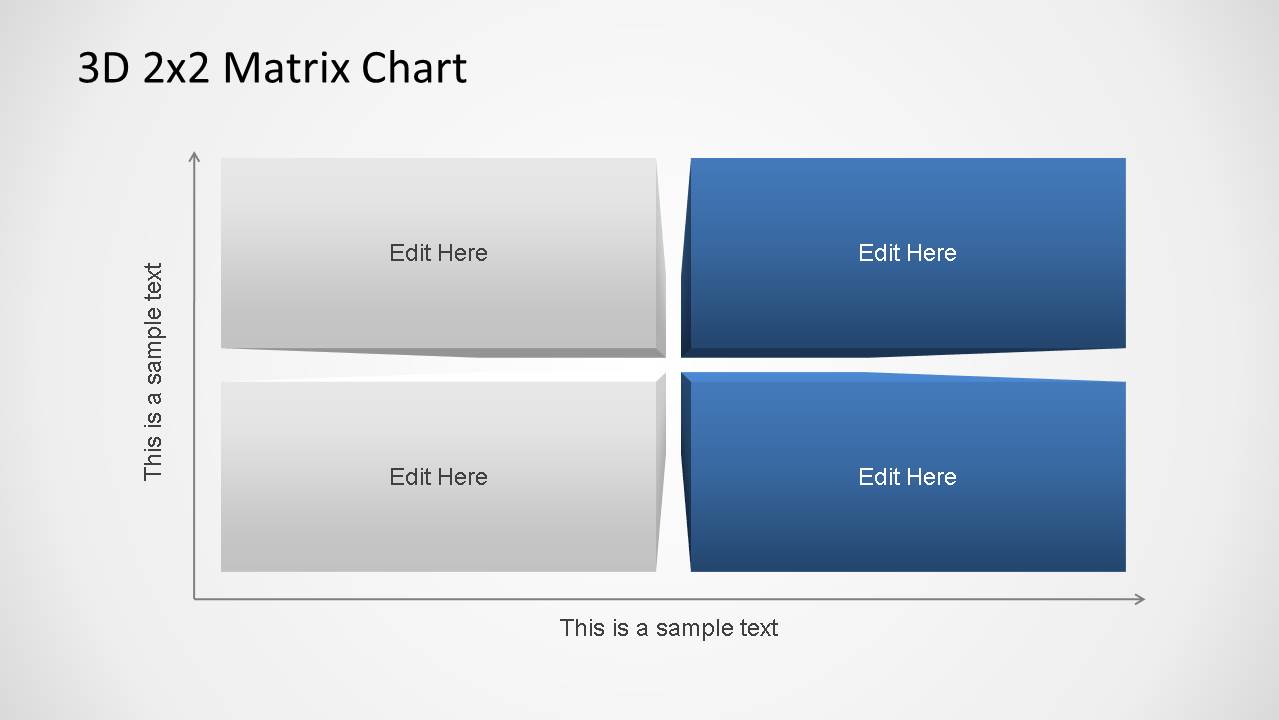
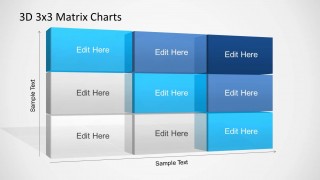
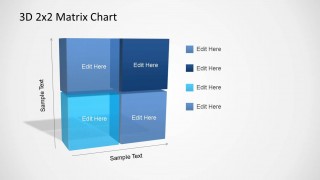
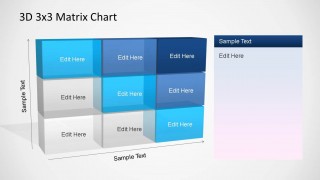
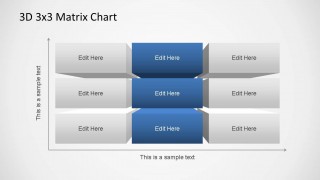
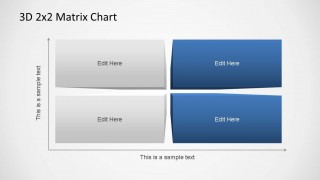
3D Matrix Charts PowerPoint Template is a professional and modern presentation built to provide different variations of a 3D Matrix. The user can build presentations that require nine-cell matrixes (3×3 3D Matrix) or four-cells matrixes (2×2 quadrant 3D Matrix). The presentation combines a 3D perspective Matrix with a cartesian axis to represent values over a 2 way axis. It also provides a series labelling, for the user to identify each cell of the matrix with the appropriate label.
The user can customize each cell, axis, label, series and title from this presentation as it is build as a composition of independent PowerPoint objects, allowing the edition of every property.
The versatility of this chart provides the user enough flexibility to use the template on any matrix-like model, just including the matrix chart in their presentation and editing the texts, labels and series in it.
Engage your audience with this appealing set of 3D Matrix Charts PowerPoint Templates. Complement your Matrix Presentation with our Data and Charts catalog.
Alternatively, you can download other matrix templates for PowerPoint & Google Slides, with 2D and 3D styles.
What’s inside this template
Example presentation scenarios
- A management consultant can use the 3x3 matrix to compare market attractiveness against competitive strength and explain which segments deserve attention.
- A product manager can use the 2x2 quadrant chart to map features by business value and implementation effort before prioritization discussions.
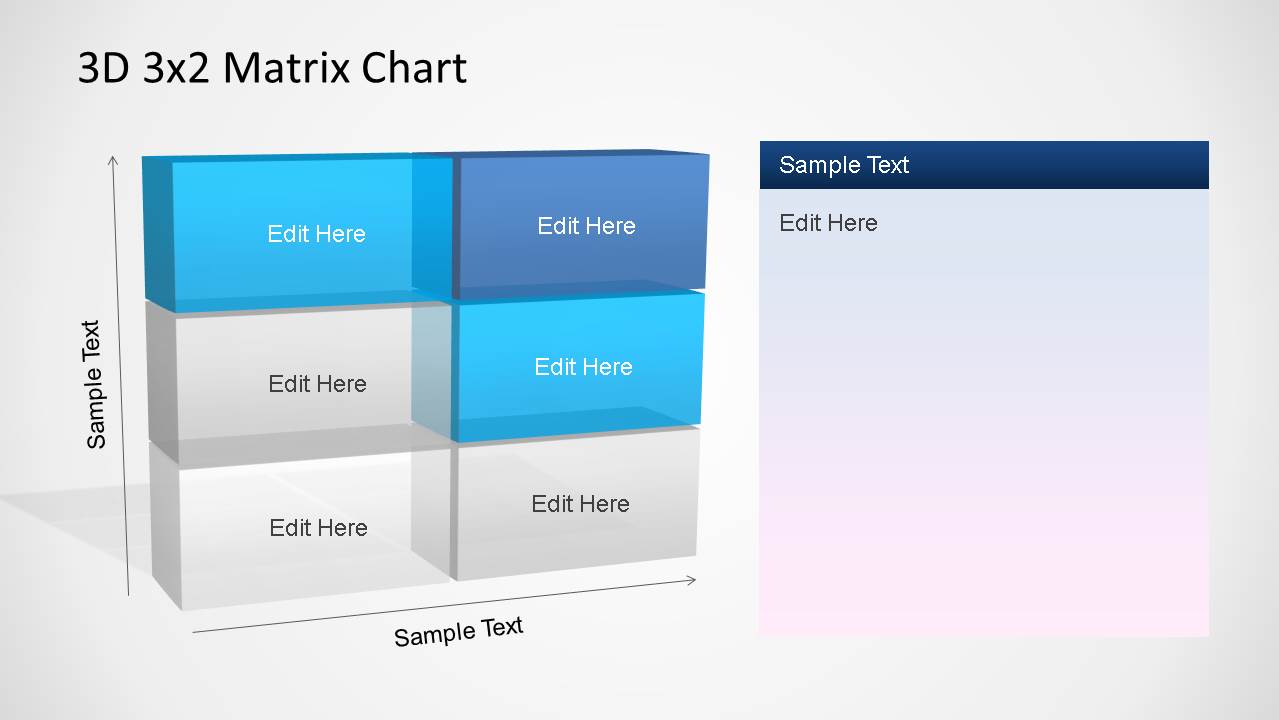
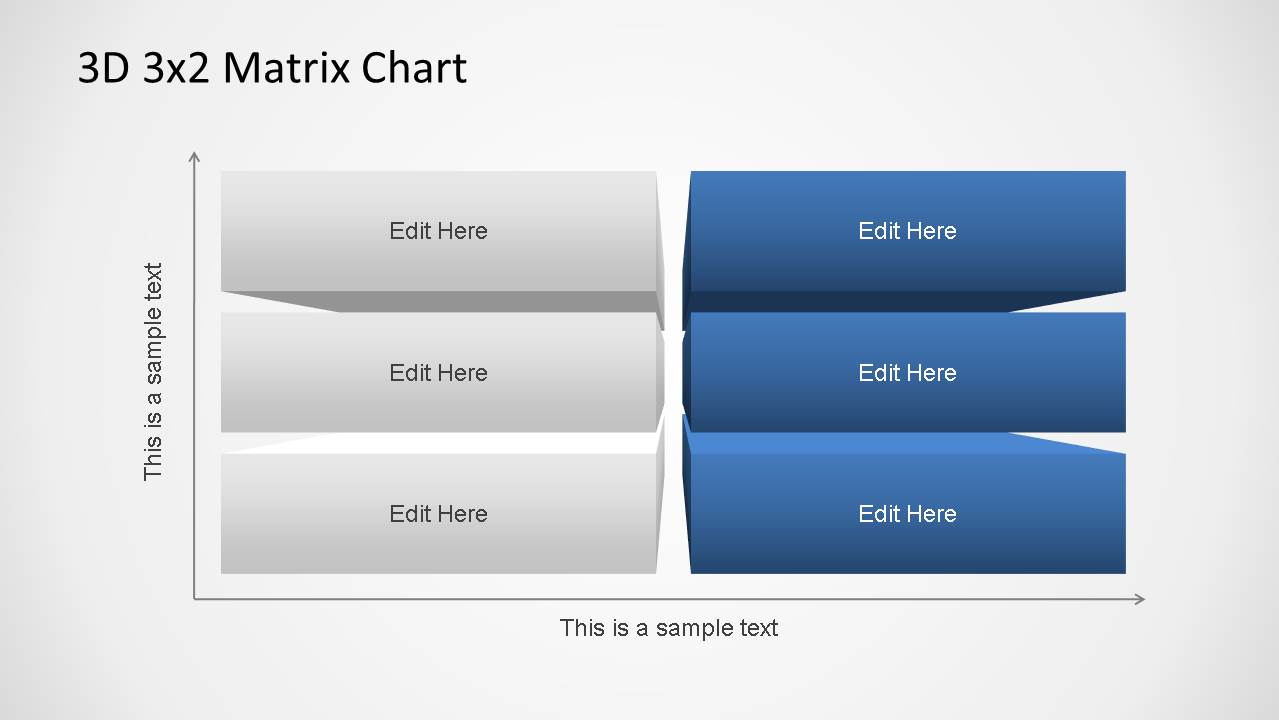
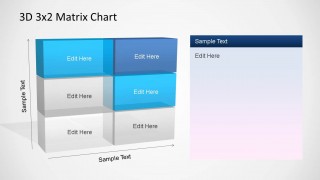
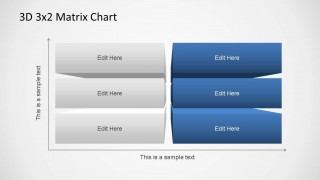
- A marketing strategist can use the 3x2 matrix with a side notes panel to classify campaign options and summarize the recommendation beside the diagram.
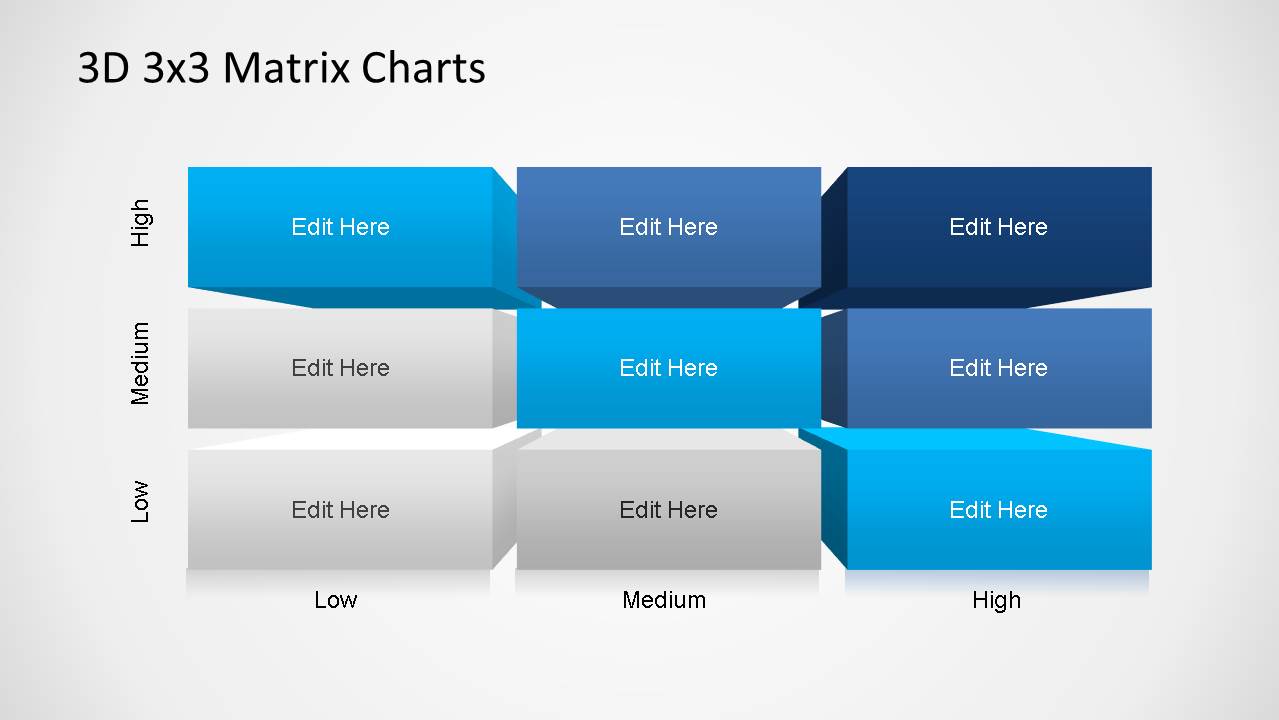
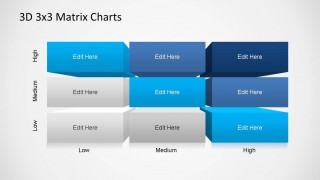
- An executive analyst can use the low, medium, and high 3x3 chart to present risk levels, opportunity size, or readiness across business units.
Features
- 100% editable presentation template
- Compatible with Microsoft PowerPoint and Google Slides
- 16:9 aspect ratio slides
- Scalable vector shapes, icons and illustrations
- AI-Ready for Microsoft Copilot and Claude
- Instant access and download
Frequently asked questions
Q: How should a presenter explain a matrix chart without overloading the audience?
A: Start by naming the two axes before discussing any cell. Then move through the matrix by priority, not by every box in order. In this template, the brighter cyan and darker blue cells can mark the areas that matter most, while the gray cells can hold context or lower-priority categories.
Q: Who is this template best suited for in a business presentation?
A: This template fits consultants, strategists, product managers, and analysts who need to classify options rather than show a numeric trend. The 2x2 quadrant works well for quick executive decisions, while the 3x3 and 3x2 layouts support more nuanced portfolio, risk, opportunity, or priority mapping.
Q: Why use a 3D matrix instead of a flat table?
A: The 3D block treatment gives each category a stronger visual boundary than a standard table, which helps the audience see positions as zones rather than rows of text. The perspective view also makes selected cells feel more prominent, supporting discussion around strategic focus, gaps, and relative positioning.
3D Matrix Charts PowerPoint Template
8-slide presentation template with 3D 2x2 and 3x3 matrix charts for quadrant analysis
The 3D Matrix Charts PowerPoint Template is an 8-slide set of editable 16:9 matrix diagrams for business analysis. It includes 2x2 quadrant charts, 3x3 matrix charts, 3x2 matrices, axis labels, legends, and side text panels for consultants, strategists, analysts, and managers using Microsoft PowerPoint or Google Slides.
- Category
- Matrix Charts
- Rating


 Loading...
- Aspect ratio
- 16:9
- Item ID
- 6476
- Colors
 Microsoft PowerPoint
  Microsoft Copilot
  Claude for PowerPoint
 Other formats supported
Subscribe today and get immediate
access to download our PowerPoint templates.