Animated BCG Matrix PowerPoint Template
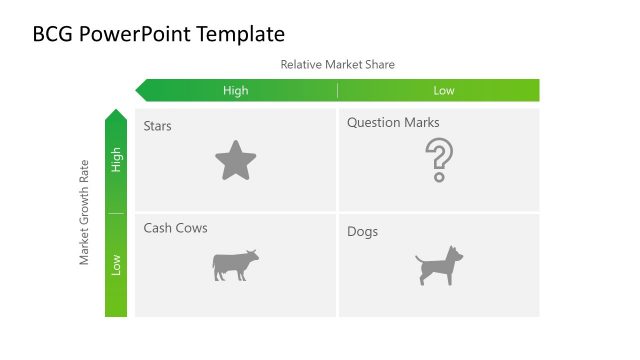
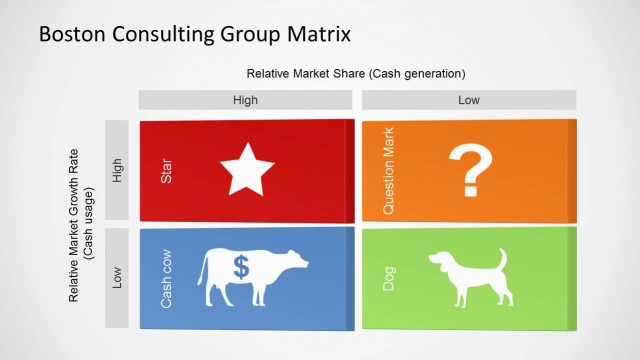
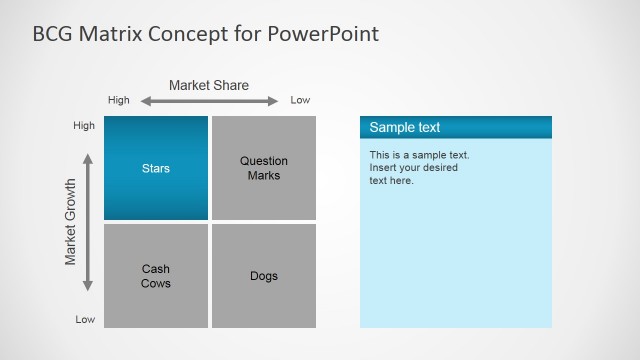
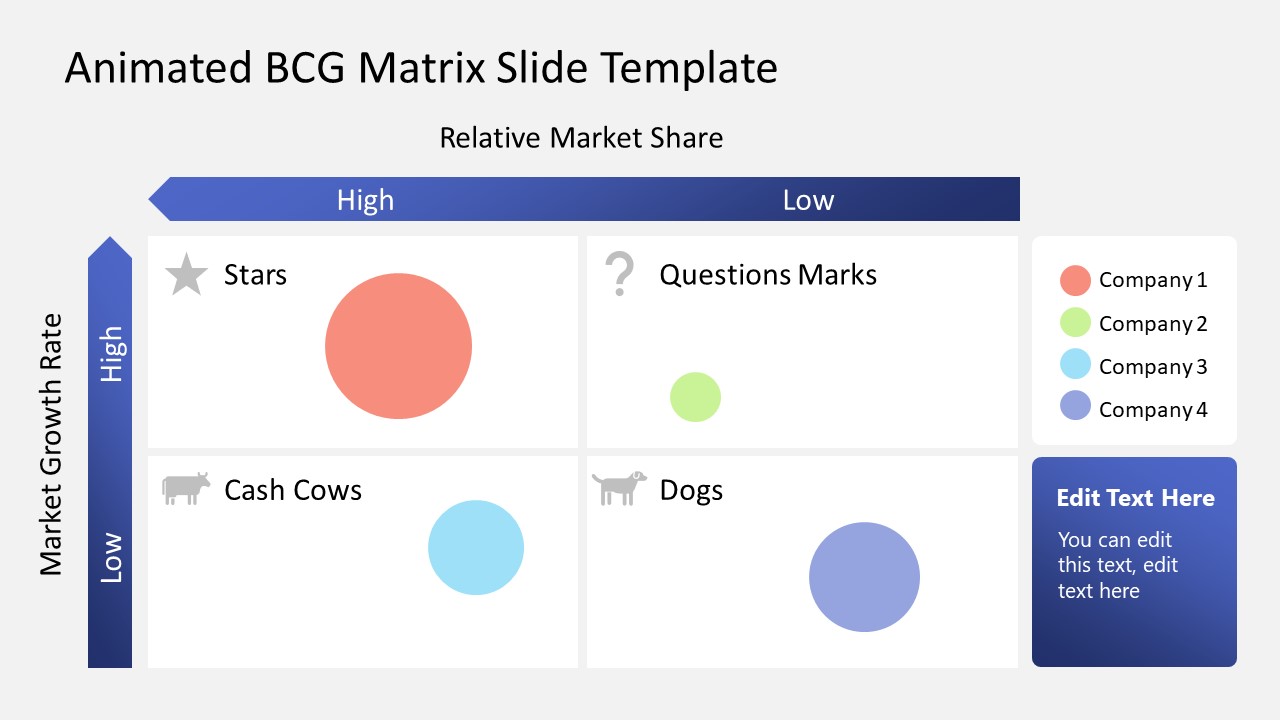
Customize our Animated BCG Matrix PowerPoint Template with a 100% editable BCG matrix chart for your business and planning presentations. The BCG or Boston Consulting Group growth-share matrix is famous for prioritizing company investments, project tasks, or products. The matrix helps distribute various elements depending on their relative market share and growth rate. Professionals use this simple yet beneficial tool to manage their company investments. For instance, during a market decline, businesses need to decide to keep certain projects on the board while rescheduling others. This grid has two parameters: market growth rate on its y-axis and relative market share on the x-axis. The four quadrants indicate the priority categories that are:
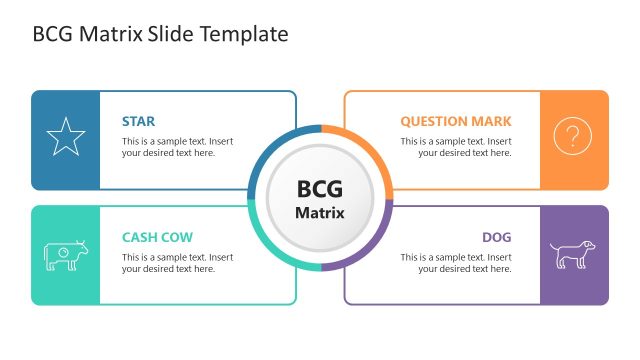
- Stars: These projects have a high growth rate and high market share. Companies invest more in such activities to each more return on investments.
- Cash cows: The cash cows are projects with low growth but hold a big market share. Such projects are beneficial till they stop giving a stable return and become question marks.
- Question marks: The projects with a low market share but high growth potential are called question marks because companies put them on option. If the market conditions are suitable, investments can be allocated for these projects, and a considerable return can be expected.
- Dogs/pets: The lower right quadrant represents this category of the BCG matrix, which includes tasks with no market share or growth potential. Usually, these projects are ruled out for investment and filtered the rest of the tasks.
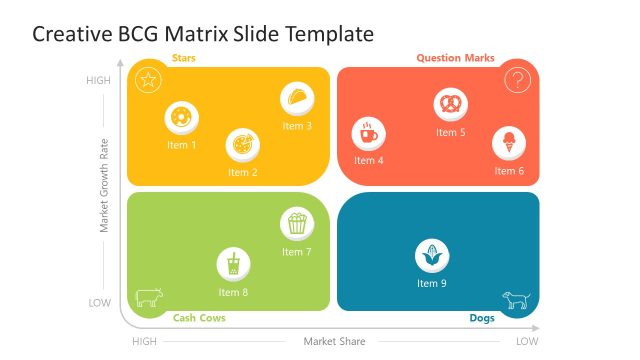
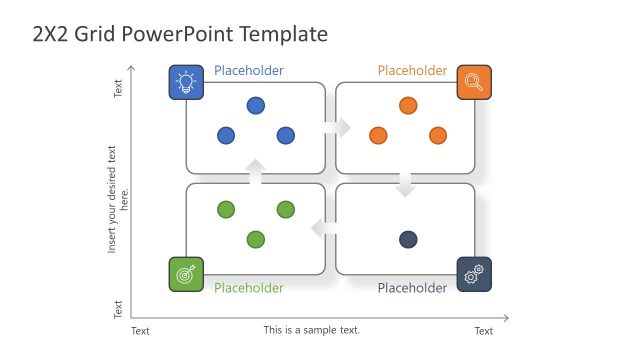
Our Animated BCG Matrix PowerPoint Template is a one-pager slide template showing the four editable quadrants of the grid. The background is light blue; thus, the four white-colored quadrants appear prominent. The quadrants carry color-coded circles and representative graphical icons for the categories. Users can name each color using the provided color legend on the right side of the slide. On both axes, gradient-colored arrows are used to showcase the trends of the parameters (from high to low). An additional text box is added on the slide to assist the presenters in displaying the necessary details. All components of the slide have animation effects. On the slide show, each segment appears one-by-one that helps in better explanation. So, download and try this matrix template for your business or planning purposes!

You must be logged in to download this file.
DOWNLOAD- Category
- Matrix Charts
- Rating

 Loading...
- Size
- 16x9
- Item ID
- 65028-01
- Colors
Subscribe today and get immediate
access to download our PowerPoint templates.