Microsoft PowerPoint
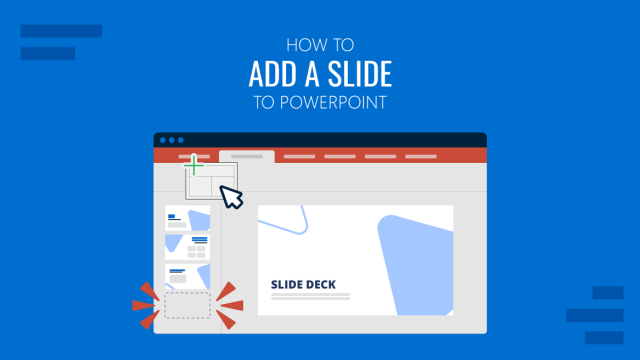
How to Add a Slide to PowerPoint
Learn how to add a slide to PowerPoint quickly, whether you’re building a deck from scratch or mid-flow.
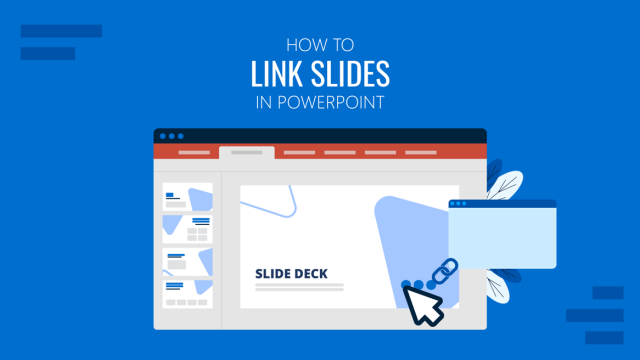
How to Link Slides in PowerPoint
Want a more dynamic presentation? Here’s how to link slides in PowerPoint for smoother, smarter navigation.
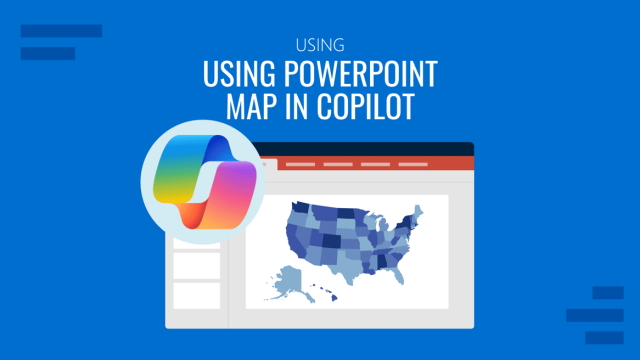
How to Populate a PowerPoint Map Using Copilot
See the exact Copilot prompt that reads an Excel address list and drops pins, city labels and a filled table onto a map slide.
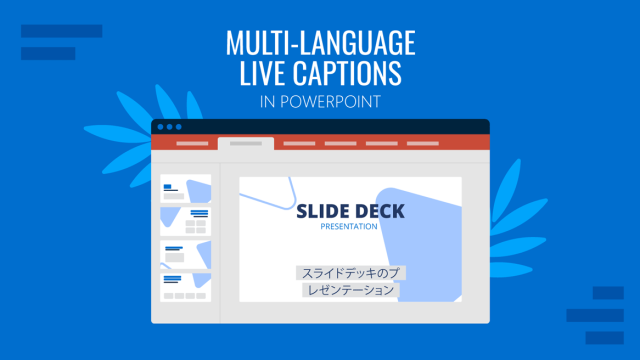
How to Translate Live Captions in PowerPoint for Multilingual Presentations
Discover how easy is to use multilingual live captions in PowerPoint and create content for multicultural audiences.
How to Insert Emoji in PowerPoint
Emoji can make slides more relatable and visually engaging. Here’s how to insert them in PowerPoint and use them effectively without overdoing it.
How to Create an Interactive Map in PowerPoint
Interactive maps turn static geography into an engaging experience. This guide walks you through how to build a clickable, navigable map in PowerPoint.
How To Create a Professional Presentation With SlideModel and PowerPoint Copilot
Combine a SlideModel template with PowerPoint Copilot: layout-safe prompts, honest limits, and how to pick a model.
How to Animate a Map in PowerPoint
Learn how to animate a map in PowerPoint and guide your audience through locations, routes, or regions.
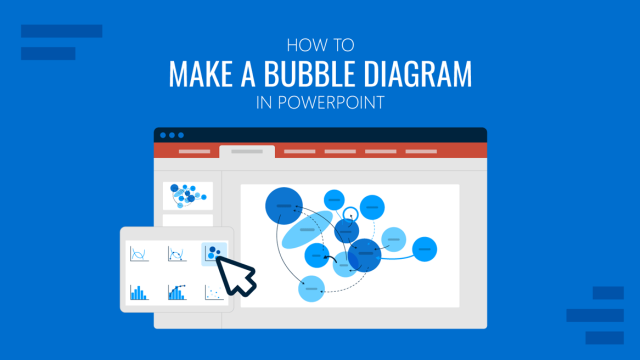
How to Create a Bubble Diagram in PowerPoint
Discover how easy it is to create detailed bubble diagrams in PowerPoint with this step-by-step, illustrated tutorial
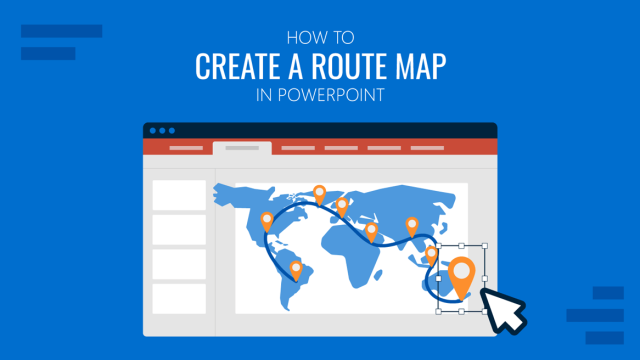
How to Create a Route Map in PowerPoint
Give exact address indications in your presentation decks by learning how to create a route map in PowerPoint
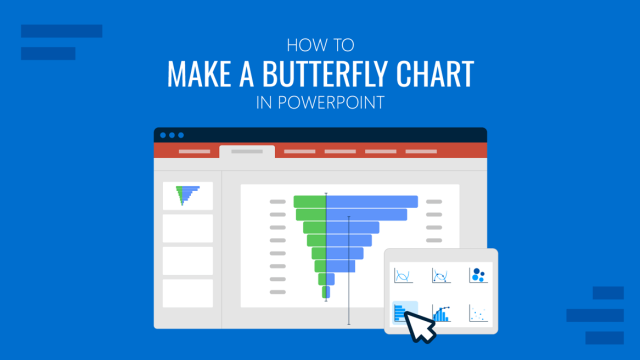
How to Create a Butterfly Chart in PowerPoint
Butterfly charts are ideal for comparing opposing data sets visually. This guide walks you through how to create a butterfly chart in PowerPoint.
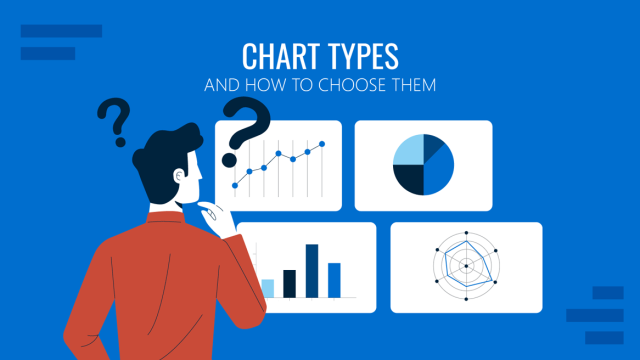
Chart Types and How to Choose Them in Presentations
A complete guide to chart types for presentations: comparison, trend, and composition charts, plus how to pick the right one fast.