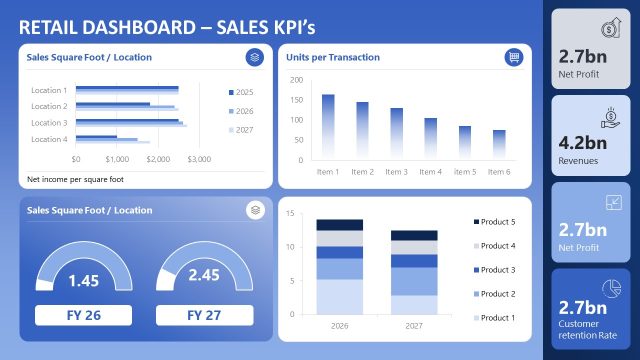
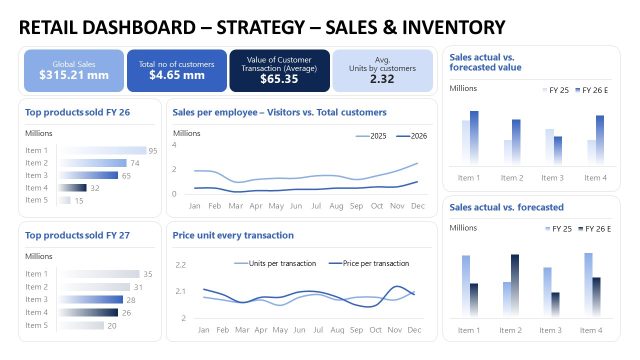
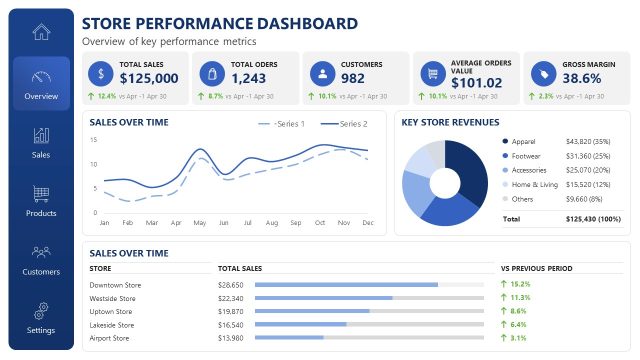
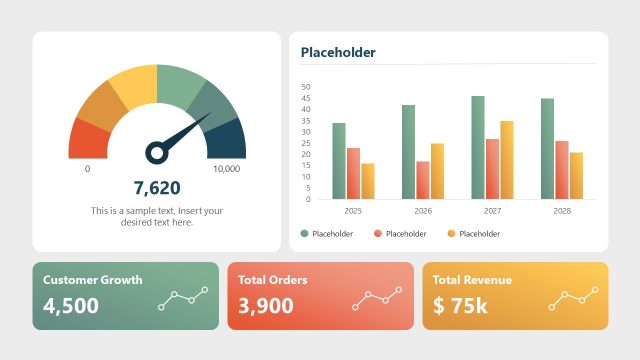
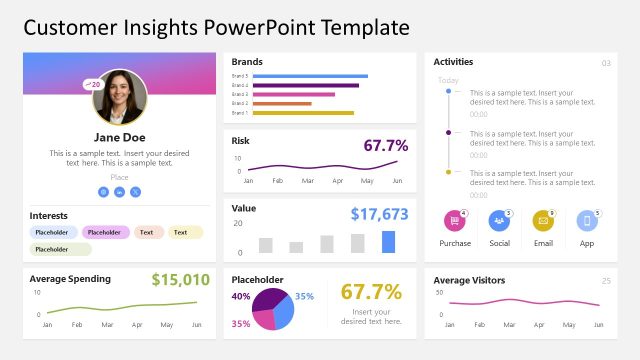
Visualize the complete website audit findings in stakeholder presentations using our editable, professional Website Performance PowerPoint Template. A website or landing page is a significant touchpoint in the customer buying journey. The website should convey a strong brand message, a strong brand image, and a clear call to action. For this purpose, optimizing the website for search crawlers and users is highly important. The website should be fast and meet various parameters across off-page domain and technical aspects. An SEO company uses this website performance dashboard template to share their seo audit findings in an understandable, ordered format. They list the conditions for Core Web Vitals, load times, and speed scores using this slide template. In addition, they have the option to modify the template use case for social media performance or paid campaigns performance reports, etc.
Marketing analysts can just change the slide titles and graphs to match their reporting needs. This PPT layout is also customizable in legacy versions of Microsoft PowerPoint. SEO consultants use this layout to outline the key technical improvements required to reduce the bounce rate and increase CTR. The Website Performance PowerPoint Template features multiple data visualizations and stat boxes that summarize large data into simple patterns. This helps stakeholders clearly understand the issues and develop strategies to implement these decisions. Website developers use this template in client presentations to outline the key performance issues and the corresponding solutions. The website performance dashboard slide template lets developers and marketing consultants mention multiple performance domains on separate slides:
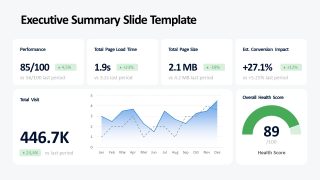
- Executive Summary Slide
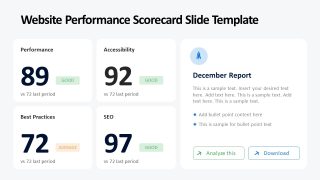
- Website Performance Scorecard Slide
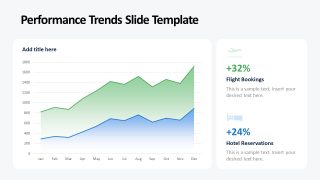
- Performance Trends Slide
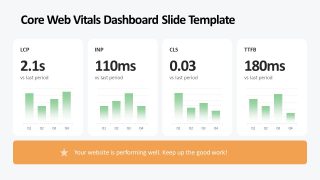
- Core Web Vitals Dashboard Slide
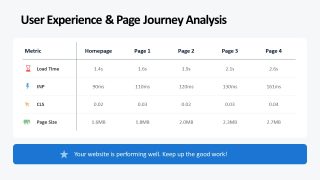
- User Experience & Page Journey Analysis
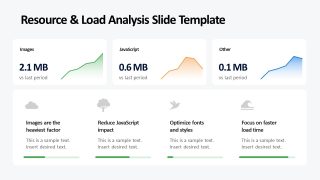
- Resource & Load Analysis Slide
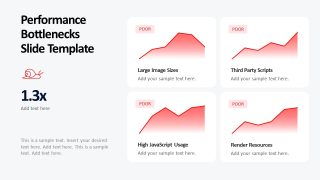
- Performance Bottlenecks Slide
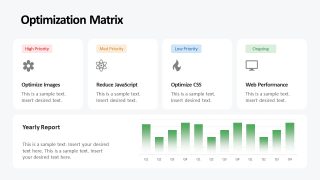
- Optimization Matrix
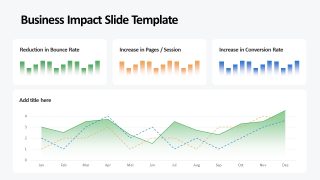
- Business Impact Slide
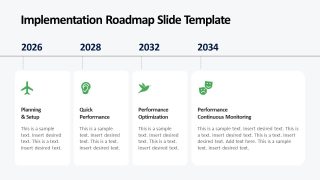
- Implementation Roadmap Slide
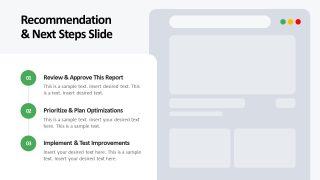
- Recommendation & Next Steps Slide
Download the website performance PPT template and share the comprehensive technical audit scorecard with business owners or executive members. Adjust the design to accurately match your brand theme.
What’s inside this template
Example presentation scenarios
- An SEO consultant can use the scorecard and Core Web Vitals dashboard to explain audit findings to a client and show which performance signals need attention.
- A web development lead can use the bottleneck slide and resource load analysis to brief engineers on image, script, CSS, and rendering issues before sprint planning.
- A digital marketing manager can use the business impact slide to connect page speed changes with bounce rate, pages per session, and conversion rate trends.
- An agency account manager can use the optimization matrix and implementation roadmap to align the client on priority fixes, ownership, and phased follow-up work.
Features
- 100% editable presentation template
- Compatible with Microsoft PowerPoint
- 16:9 aspect ratio slides
- Scalable vector shapes, icons and illustrations
- AI-Ready for Microsoft Copilot and Claude
- Instant access and download
Frequently asked questions
Q: How should I present technical website metrics without losing nontechnical stakeholders?
A: Start with the executive summary and scorecard to set the health baseline, then move into Core Web Vitals and page journey details only after the audience understands the headline risk. Use the optimization matrix to separate urgent fixes from lower priority work, and close with the roadmap and next steps to convert findings into decisions.
Q: Who is this template best suited for?
A: It fits SEO consultants, web developers, performance marketing teams, and digital product owners who need to explain why a site is slow, where the issues appear, and what should happen next. The scorecard, bottleneck slide, and business impact slide help connect technical findings to conversion, bounce rate, and customer experience discussions.
Q: Why does the deck use dashboards, cards, and a roadmap instead of one long audit table?
A: The card-based dashboards reduce cognitive load by isolating one metric per panel, while the table compares pages without forcing a narrative. The bottleneck cards and optimization matrix create a triage metaphor: identify symptoms, rank fixes, then schedule treatment. The roadmap completes that logic by turning an audit into a phased work plan.
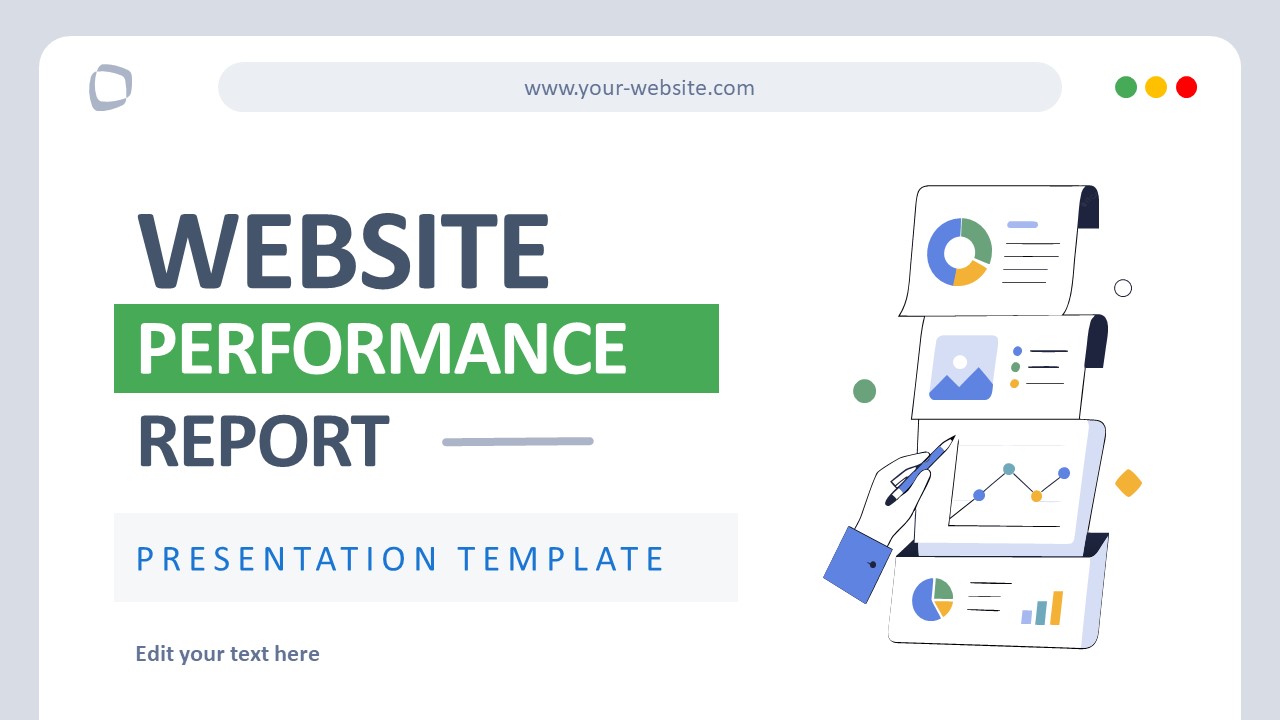


Website Performance PowerPoint Template
12-slide website performance presentation template with audit scorecards, Core Web Vitals dashboards, and roadmap layouts
The Website Performance PowerPoint Template is a 12-slide, 16:9 Microsoft PowerPoint deck for reporting website audit results. It includes an executive summary dashboard, website performance scorecard, Core Web Vitals dashboard, page journey table, optimization matrix, business impact slide, implementation roadmap, and recommendation slide for SEO, marketing, and development teams.
- Category
- Business PowerPoint Templates
- Rating

 Loading...
- Aspect ratio
- 16:9
- Item ID
- 94231-01
- Colors
 Microsoft PowerPoint
  Microsoft Copilot
  Claude for PowerPoint
 Other formats supported
Subscribe today and get immediate
access to download our PowerPoint templates.