Slide 4 of 12 from Website Performance PowerPoint Template
Performance Trends Visualization Slide with Area Plot
Performance Trends Slide for Website Analysis
- Chart
- Line Chart
- Evaluation Slide
- 16:9
- 100% Editable
The Performance Trends Slide Template from the Website Performance PowerPoint Template offers a clear line chart layout ideal for business presentations focused on KPI reporting and trend analysis. This slide includes editable shapes and vector icons to highlight key metrics such as flight bookings and hotel reservations, making it suitable for corporate presentation decks and pitch deck templates that require concise performance evaluation visuals.
What’s on This Slide
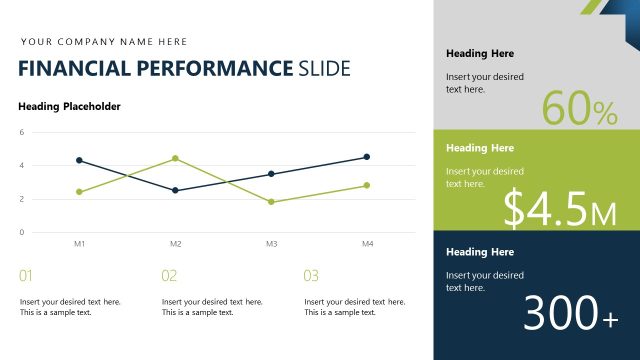
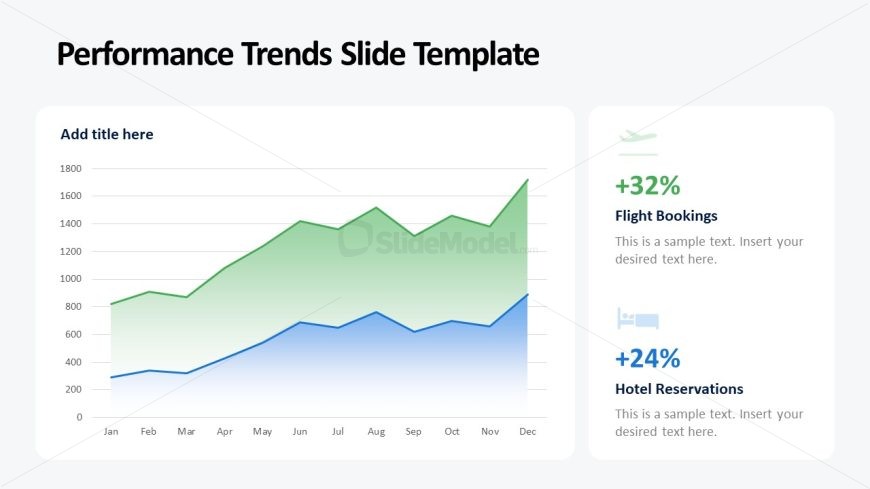
The slide features a line chart positioned on the left, displaying performance trends over months from January to December. The chart has two data series represented by green and blue lines, with the green line indicating flight bookings and the blue line indicating hotel reservations. On the right side, there are two text placeholders for key metrics, each with an icon: one for flight bookings showing a +32% increase and another for hotel reservations showing a +24% increase. The slide has a light background with a clear visual hierarchy emphasizing the chart and metrics.
How to Use It
This layout serves to present performance trends over time, suitable for business presentations analyzing website metrics. It fits well after introductory slides and before detailed analysis, providing a snapshot of key performance indicators. This slide is ideal for reporting increases in bookings or reservations, making it useful for marketing or management teams assessing growth strategies. It can also be used in quarterly reviews or performance audits to highlight trends and achievements.
Text Placeholders & Capacity
Keep your copy within these limits so it fits without resizing. Node labels can hold about 2-3 words each, while node bodies can accommodate roughly 10-12 words.
| Placeholder | Count | Max characters (approx.) |
|---|---|---|
| Slide title | 1 | 30 |
| Item heading | 2 | 15 |
| Item body | 2 | 50 |
Slide Keywords
Download unlimited PowerPoint templates, charts and graphics for your presentations with our annual plan.
DOWNLOADReturn to Website Performance PowerPoint Template.