Lightweight Store Performance Dashboard PowerPoint Template
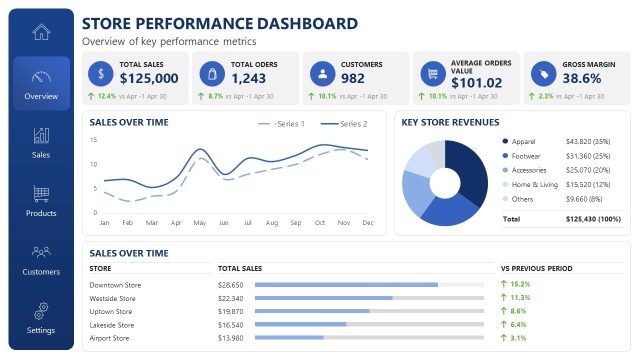
Review the company’s sales performance and financial standings in the executive presentations with our Lightweight Store Performance Dashboard PowerPoint Template. In key strategic meetings, business leaders and board members use the dashboard, which features multiple data visualizations. Data visualization may include charts and graphs such as line, bar, donut, and column charts. These elements help analysts share their findings efficiently in stakeholder presentations or annual review meetings. The charts help stakeholders and investors identify patterns in the data to inform decisions for upcoming business growth plans. Also, they can mitigate potential risks using insights and trends derived from the data. This PPT slide layout is useful for strategy directors and team leaders to showcase their achievements in high-level business presentations.
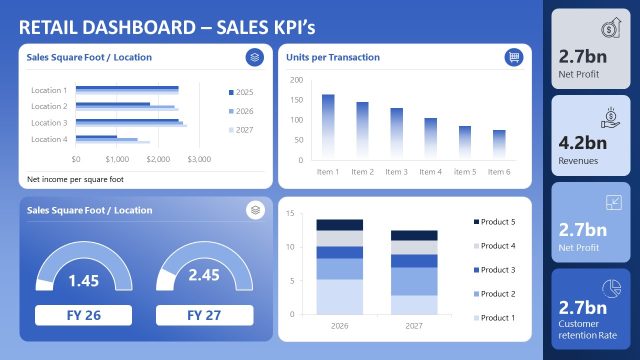
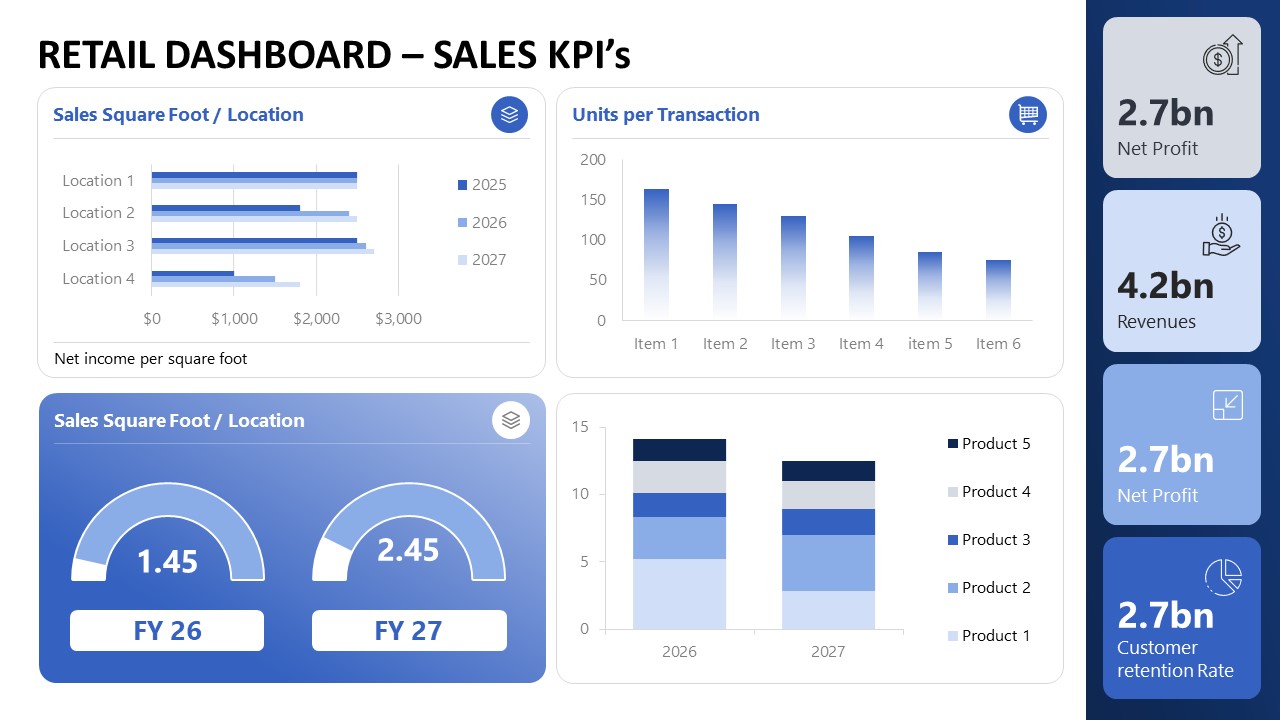
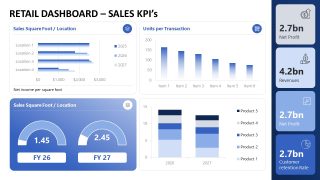
The Lightweight Store Performance Dashboard PowerPoint Template features three slides with the same dashboard style, but with different components and purposes. The first slide allows business analysts to demonstrate the Sales KPIs. There are four blocks arranged in a 2×2 layout with a vertical bar on the right containing data segments. Marketing consultants can showcase the following data points on the slide one:
- Sales square foot/ location and comparison of different fiscal years
- Units per transaction
- Net Profit
- Revenue
- Customer retention rate
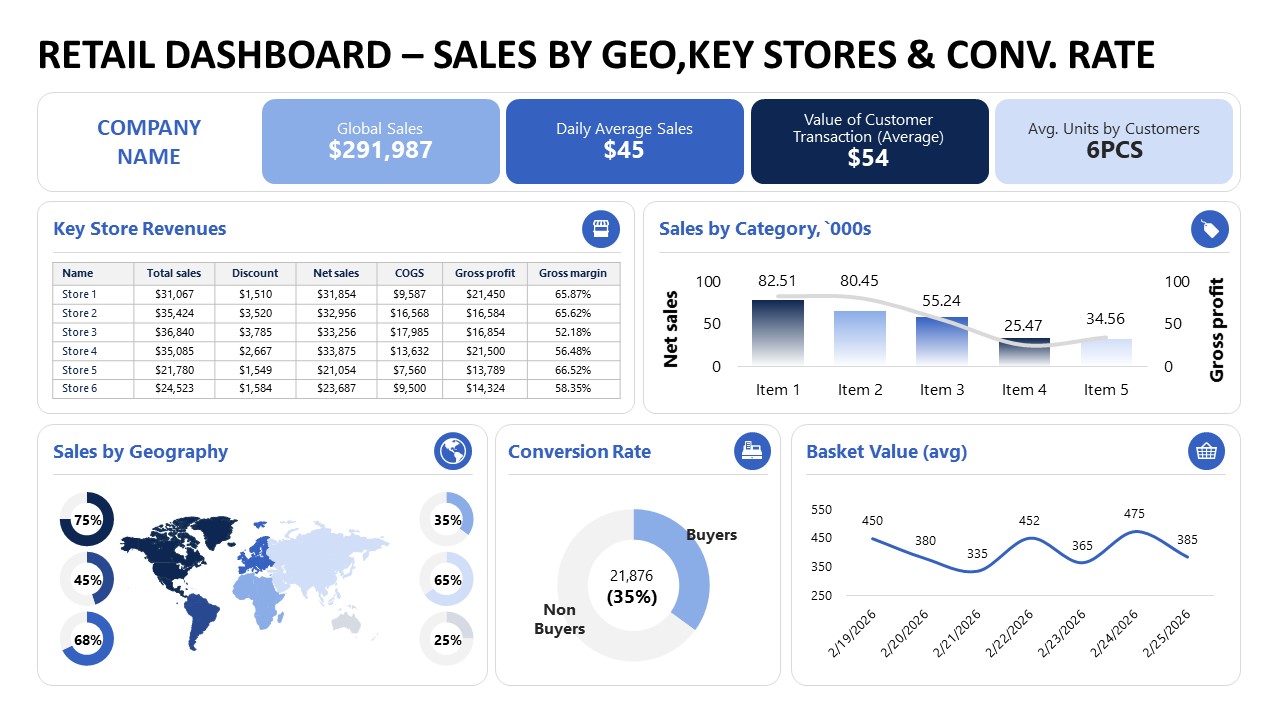
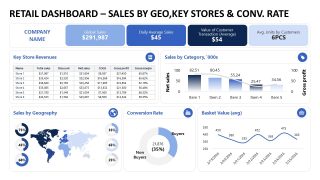
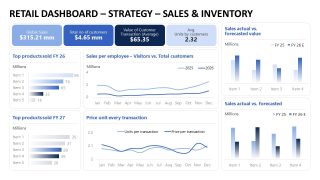
The second slide lets business intelligence experts showcase sales trends and insights by Geo, key stores, and conversion rates. Likewise, business consultants use the third slide to compare actual sales vs. forecasted sales, inventory, and sales per employee. We enable our users to modify the types of data, charts, graphs, segments, currencies, labels, and other dashboard components to visualize their data accurately. Download the lightweight store performance dashboard PPT template for your next stakeholder review presentations.

You must be logged in to download this file.
DOWNLOAD- Category
- Business PowerPoint Templates
- Rating


 Loading...
- Size
- 16x9
- Item ID
- 23669-01
- Colors
Subscribe today and get immediate
access to download our PowerPoint templates.