Slide 5 of 12 from Website Performance PowerPoint Template
Core Web Vitals Display Slide with Bar Charts
Core Web Vitals Dashboard Slide Template
- Chart
- Dashboard Composite
- Evaluation Slide
- 16:9
- 100% Editable
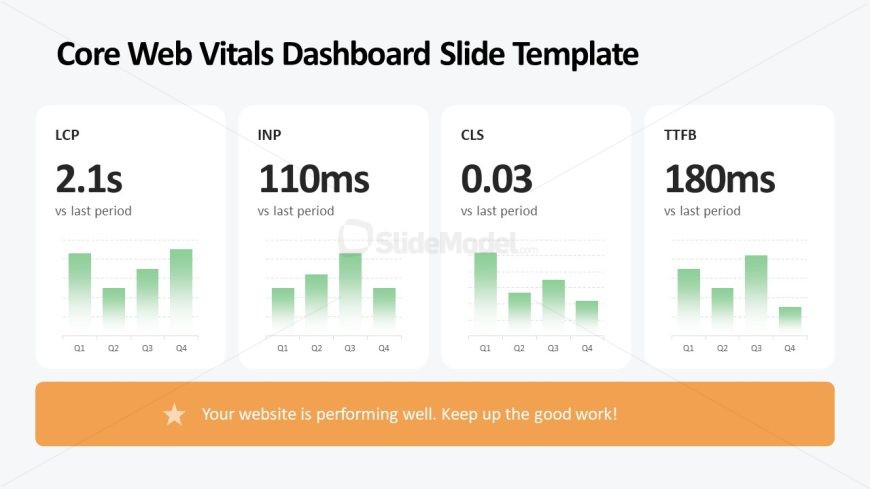
The Core Web Vitals Dashboard slide from the Website Performance PowerPoint Template offers a clear and concise layout for evaluating key website metrics. This slide template includes editable shapes and vector icons to visually represent LCP, INP, CLS, and TTFB metrics with bar charts, making it suitable for business presentations focused on website performance reviews and client updates.
What’s on This Slide
The layout features four distinct sections arranged horizontally. Each section contains a title, a metric value, and a small bar chart. The sections are labeled LCP, INP, CLS, and TTFB, positioned from left to right. Below the sections, a prominent orange rectangular container displays a motivational message. The background is light gray, providing contrast to the elements. Each metric section has a consistent design, with the bar charts showing performance trends over four quarters. Text placeholders exist for the metric values and titles, aligned centrally within each section.
How to Use It
This layout serves as a dashboard for presenting key performance metrics related to website performance. It fits well in a presentation sequence following an analysis of website performance issues. This slide is useful for stakeholders needing a quick overview of Core Web Vitals, making it ideal for performance reviews, client presentations, or team updates. It succinctly conveys critical data points and trends, allowing for immediate comprehension of website health.
Text Placeholders & Capacity
Keep your copy within these limits so it fits without resizing. Node labels can hold about 2 words each, while body slots can fit around 4 words.
| Placeholder | Count | Max characters (approx.) |
|---|---|---|
| Item heading | 4 | 10 |
| Item body | 4 | 20 |
| Callout | 1 | 50 |
Slide Keywords
Download unlimited PowerPoint templates, charts and graphics for your presentations with our annual plan.
DOWNLOADReturn to Website Performance PowerPoint Template.