Insights Tip Analysis PowerPoint Template
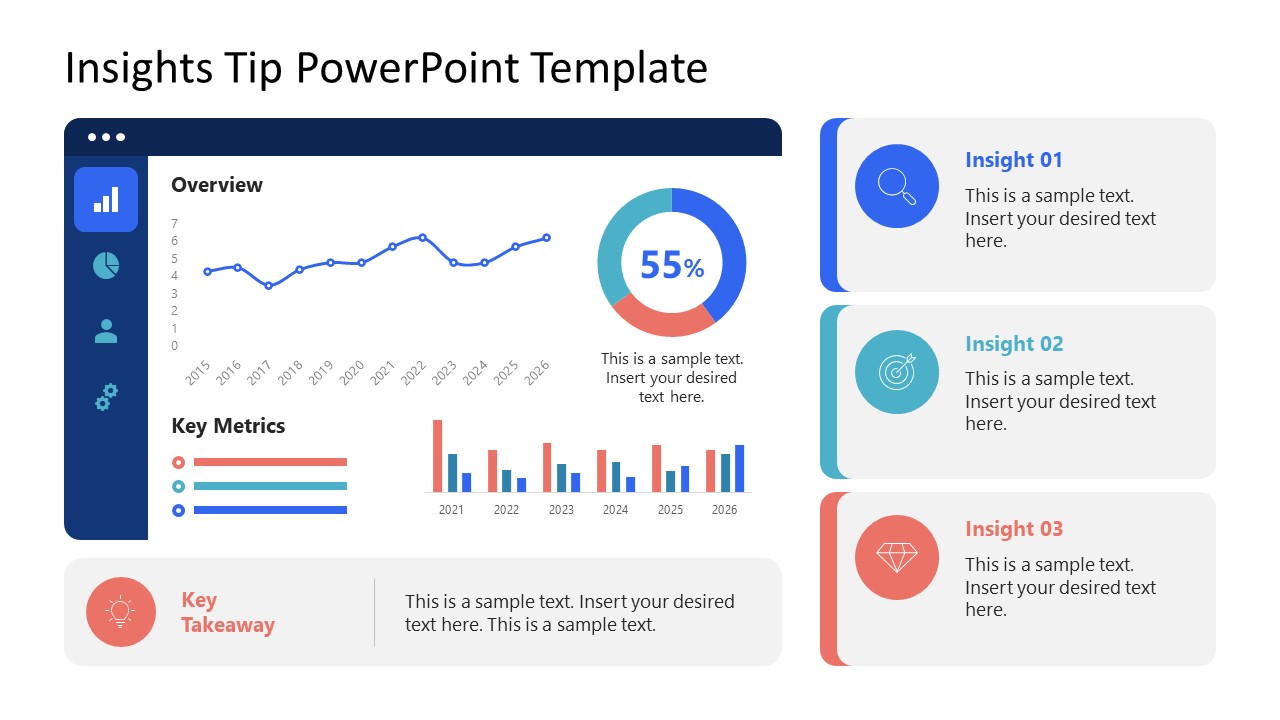
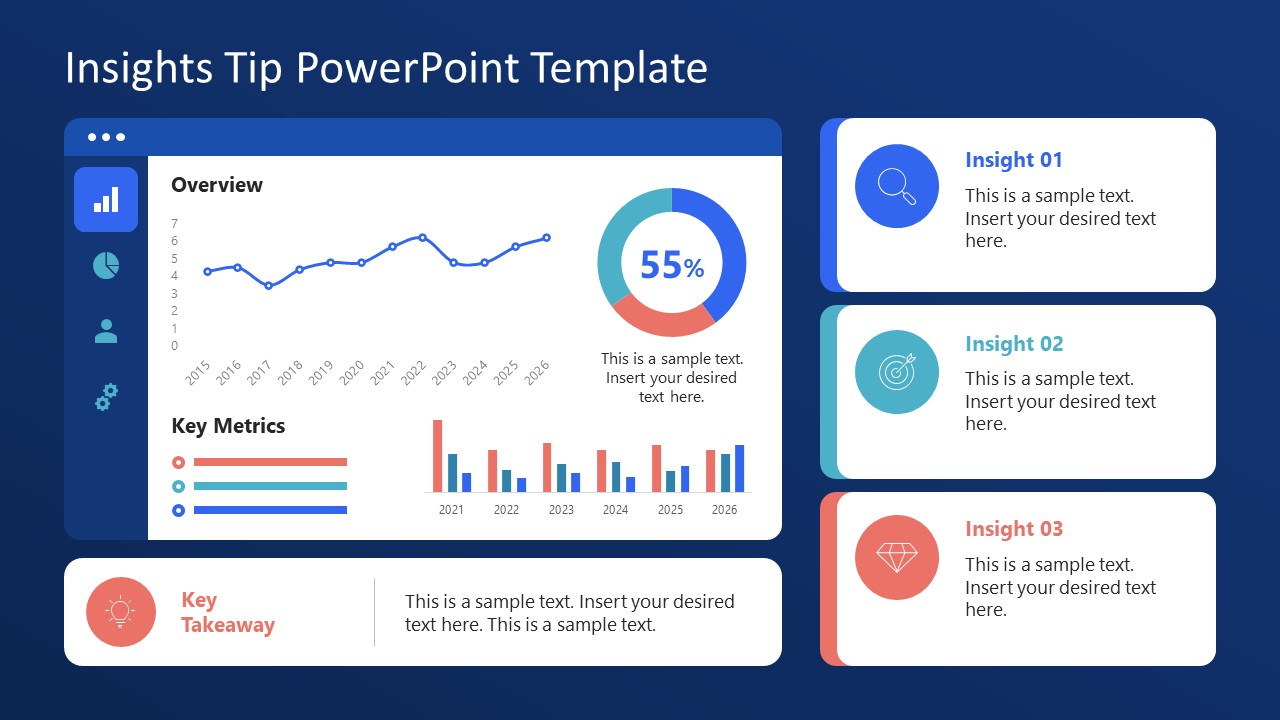
Report performance findings and highlight key business insights in the strategy presentations with the Insights Tip Analysis PowerPoint Template. The template shows a dashboard layout that keeps numerical evidence alongside interpretation, helping presenters evaluate results and identify trends and data patterns. A dark blue navigation panel anchors the layout, with three accent colors to distinguish multiple slide segments. The dashboard layout features a line chart for performance movement with a percentage graphic. Horizontal indicators show key metrics, while grouped bars provide annual comparisons across reporting periods. Three insight cards create dedicated spaces for interpreting results, while the Key Takeaway section captures the main conclusion.
The overview slide brings together annual trend data, a percentage indicator, key metrics, and year-based bar comparisons. This combination supports an initial performance review. Three Insight sections separate individual findings after the main figures. The key takeaway section helps business analysts review and guide the decision for the next strategic initiative. The second slide uses the same structure, but its background color is different (dark blue). During a quarterly management review, a business analyst can use the Insights Tip Analysis PowerPoint Template to compare performance trends and highlight three findings that require management priority. For a sales planning meeting, sales executives can use the dashboard layout to review annual results and discuss the metrics that deserve further attention.
When a department evaluates performance, the insight cards can separate findings before the team decides which result should influence planning. In an academic research review, the dashboard can summarize measured results. The presenter can then identify the central finding through the Key Takeaway section. You can also customize our modern business insights presentation template to try a different version for your next strategy meeting. Users can change the styles, color combinations, fonts, and shapes to meet their needs. They can easily change the chart types in the template to match their data. Download the insights tip presentation layout to showcase performance reviews and business insight reports in leadership presentations.
You must be logged in to download this file.
DOWNLOAD- Category
- Data & Charts
- Rating

 Loading...
- Size
- 16x9
- Item ID
- 23561-01
- Colors
Subscribe today and get immediate
access to download our PowerPoint templates.