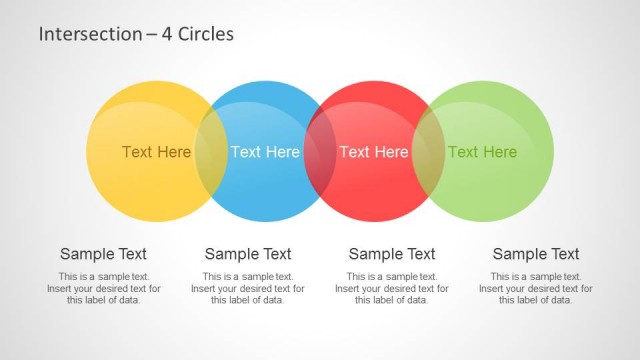
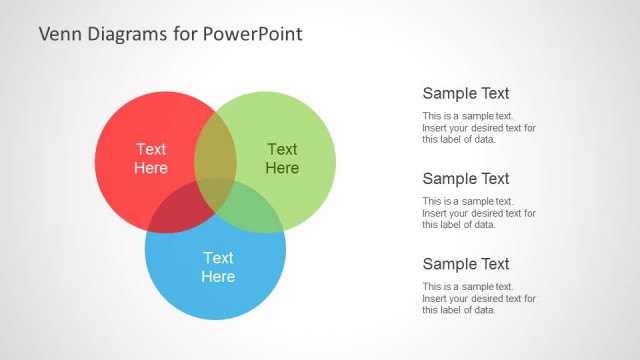
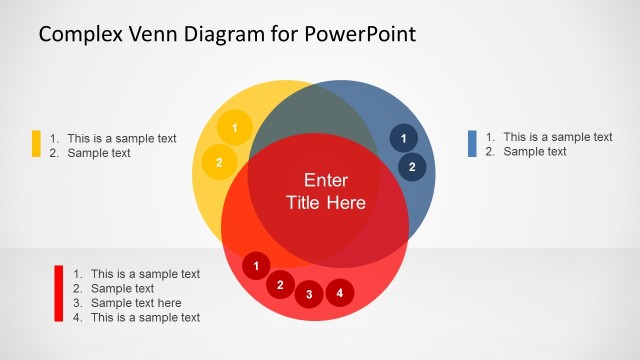
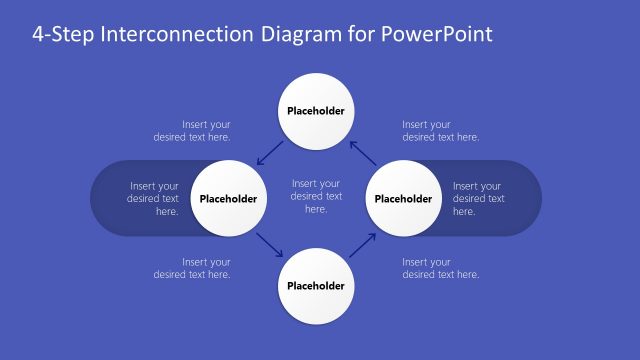
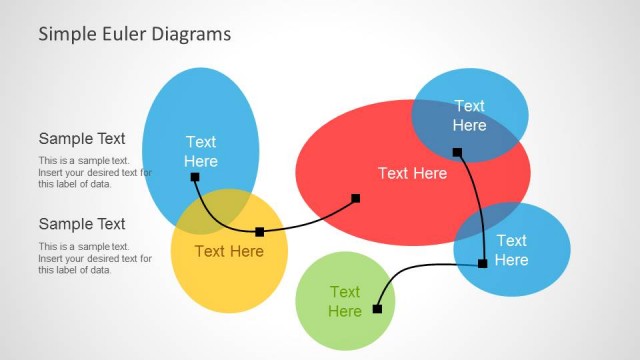
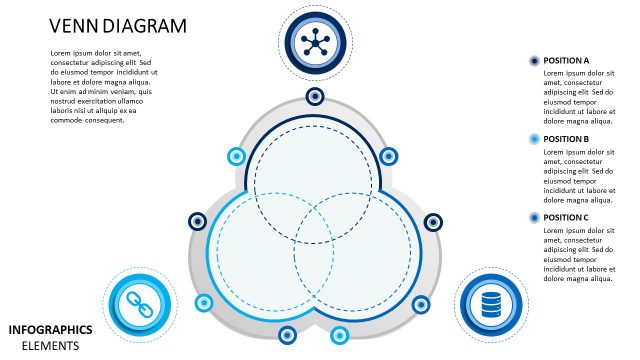
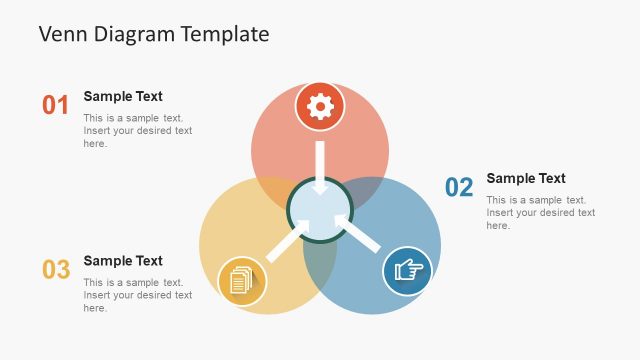
Interaction Diagrams for PowerPoint is a simple presentation template containing a set of useful Venn diagrams and interaction diagram layouts that you can use to present data in your PowerPoint slides.
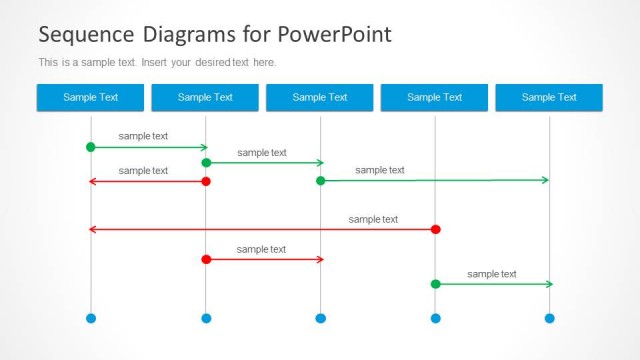
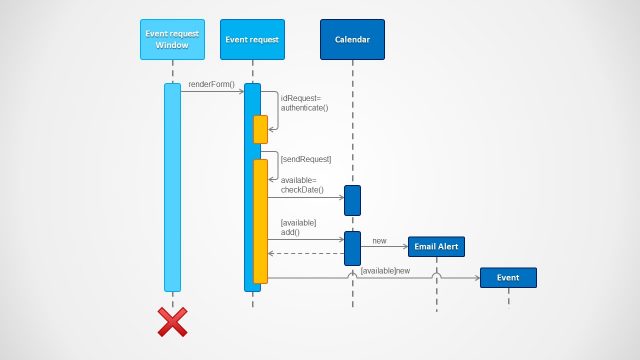
Alternatively you can download other interaction diagrams including sequence diagrams for PowerPoint or Venn Diagrams for PowerPoint presentations.
What’s inside this template
Example presentation scenarios
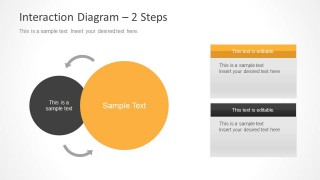
- A consultant can use the 2-step overlapping-circle slide to explain how two departments, vendors, or workstreams interact during a transformation project.
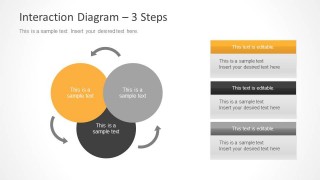
- A product manager can use the 3-step Venn-style cycle to show how customer needs, product capabilities, and business priorities overlap in roadmap planning.
- A trainer can use the title interaction diagram to introduce a lesson about set relationships, intersections, or shared responsibilities before moving into examples.
- A marketing strategist can use the side text panels with the circle diagrams to compare audience segments and explain where messaging themes intersect.
Features
- 100% editable presentation template
- Compatible with Microsoft PowerPoint and Google Slides
- Scalable vector shapes, icons and illustrations
- AI-Ready for Microsoft Copilot and Claude
- Instant access and download
Frequently asked questions
Q: How should a presenter structure the message around these interaction diagrams?
A: Start by naming each circle as a distinct idea, team, market, or factor before explaining the overlap. The side text panels on the 2-step and 3-step slides should hold short interpretation points, not long paragraphs. Use the center or intersection area to state the shared outcome or common ground the audience should remember.
Q: When is this template a better choice than a standard comparison table?
A: This template works best when the point is relationship, not ranking. A comparison table separates items into columns, while the overlapping circles show connection, shared ownership, or combined value. It fits strategy, product, training, and stakeholder discussions where the speaker needs to explain how parts influence each other.
Q: Why do the circles and arrows help communicate interaction?
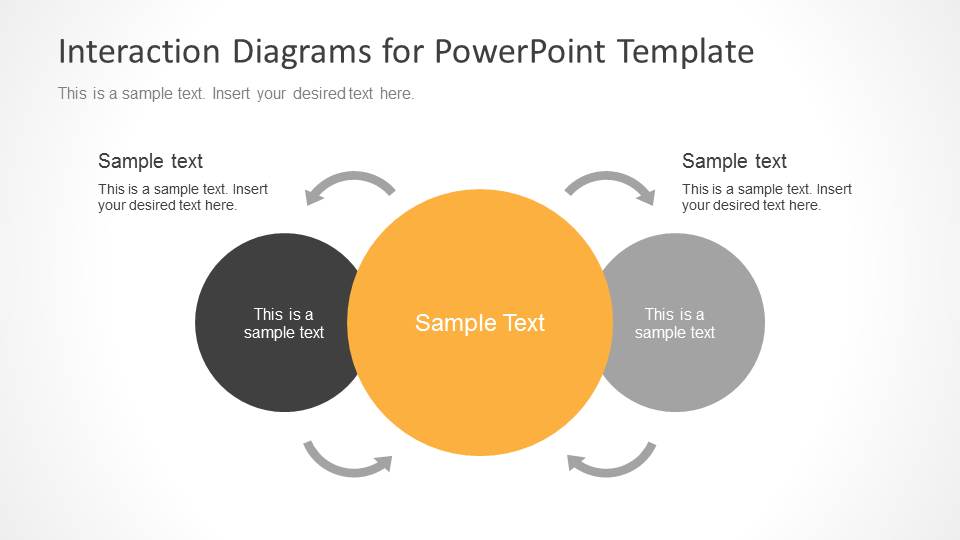
A: The Venn-style circles make overlap visible immediately, so the audience can see where concepts meet before reading supporting text. The curved arrows add a cycle metaphor, suggesting reciprocal influence rather than a one-way flow. This design helps presenters explain shared responsibility, feedback loops, and common outcomes with fewer words.


Interaction Diagrams for PowerPoint
3-slide interaction diagram presentation template with Venn-style circles, intersections, and cycle arrows
Interaction Diagrams for PowerPoint is a 3-slide diagram template for explaining relationships, overlap, and shared influence between items. It includes a three-circle interaction overview, a 2-step overlapping-circle diagram, and a 3-step Venn-style cycle diagram with editable text panels for business, training, and analysis presentations.


 Loading...
 Microsoft PowerPoint
  Microsoft Copilot
  Claude for PowerPoint
 Other formats supported
Subscribe today and get immediate
access to download our PowerPoint templates.