Sequence Diagrams for PowerPoint
Organize business plans with the Sequence Diagrams for PowerPoint. The presentation design contains a sequence diagram for software development and project planning. Sequence diagrams are a kind of interaction diagrams, also known as Gantt charts.
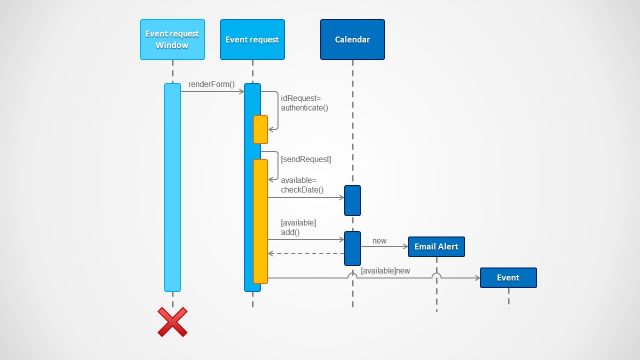
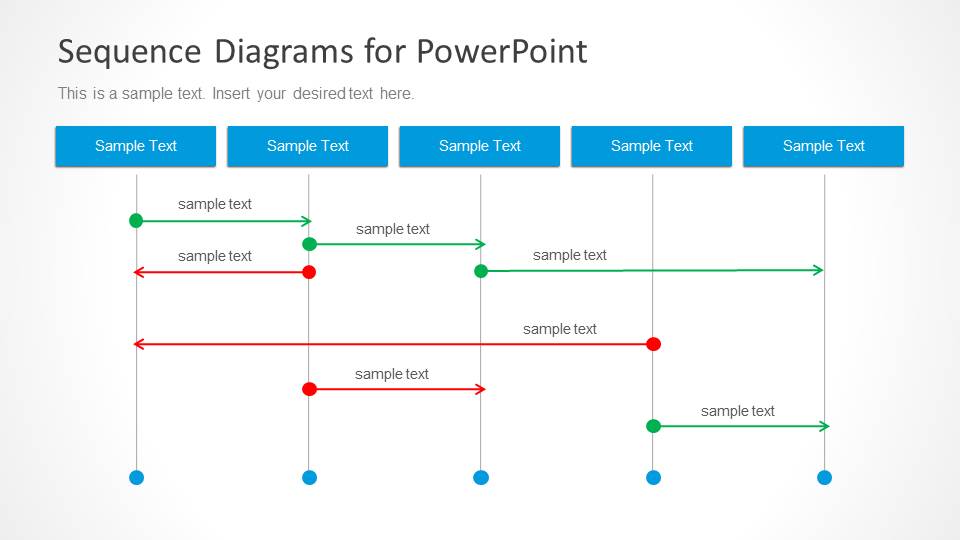
Sequence diagrams use horizontal bars and segments in the same way as a timeline. In sequence diagrams, however, several timelines – one for each activity – are shown simultaneously across the same period. There are usually two types of timelines in the diagram. The first is an estimated timeline, while the second is an actual timeline. These two types allow the users to compare the times and forecast the lengths of the succeeding events.
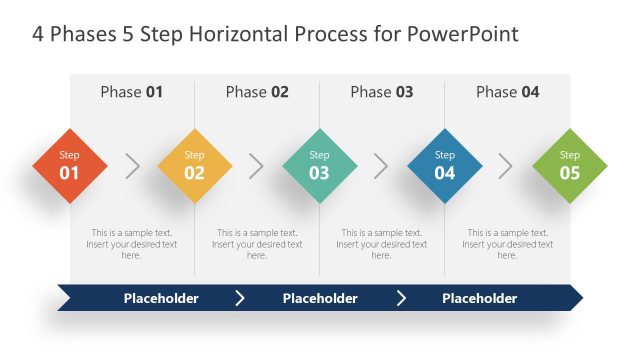
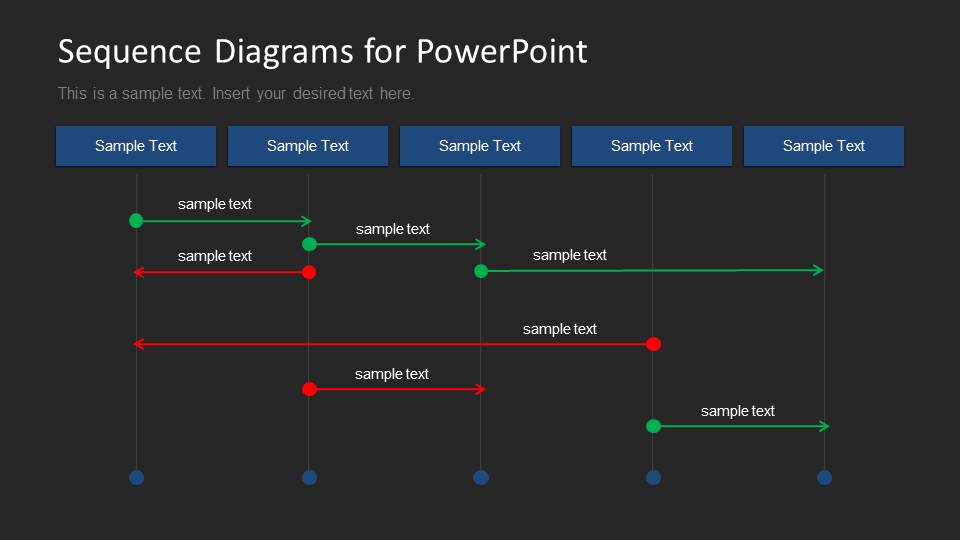
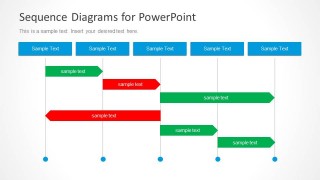
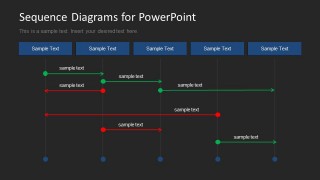
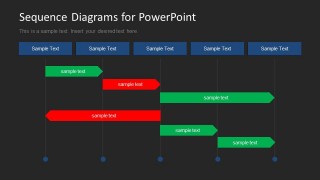
The PowerPoint template has two principal variations of the sequence diagram. The first variant uses thin line arrows, in ray form. With these slides, the presenter can bring more focus to the events themselves, rather than the length of time. The second type substitutes the line arrows with banner arrows. This type emphasizes the lengths of each sequence, giving more importance to their implementation. This is ideal when the action itself, is more significant than whether it took a long time to apply.
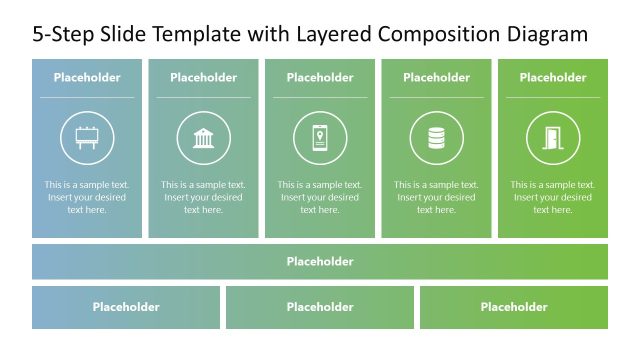
The slides have a single basic form. It is created with five rectangular headers, with text placeholders, found near the top of the slide. The timelines are located below the headers, with one timeline placed below another. The timelines are colored in either red or green, depending on whether they represent the actual or estimated times.
The Sequence Diagrams template for PowerPoint can be employed in project planning for small or large companies. These sequence diagrams permit the user to analyze schedules and implement contingency plans. Text can be inserted and colors can be modified, depending on the user’s preferences. Any modification, even to size, will not affect its graphic resolution so the design remains visually appealing.
Alternatively, you can download other sequence diagram templates, like the PowerPoint sequence diagram PPT template, process flow templates, UML templates for PowerPoint, or Gantt Chart PPT templates.


You must be logged in to download this file.
DOWNLOAD- Category
- Diagrams
- Rating


 Loading...
- Size
- 16x9
- Item ID
- 6111-02
- Colors
Subscribe today and get immediate
access to download our PowerPoint templates.