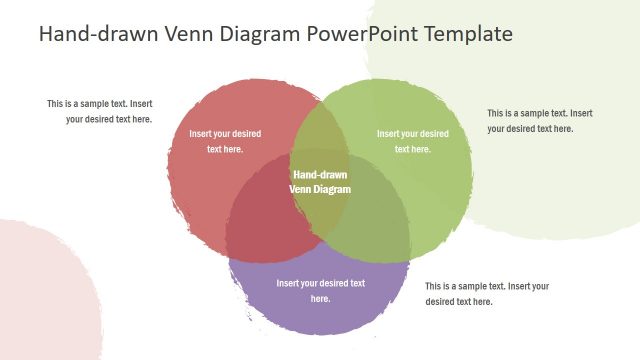
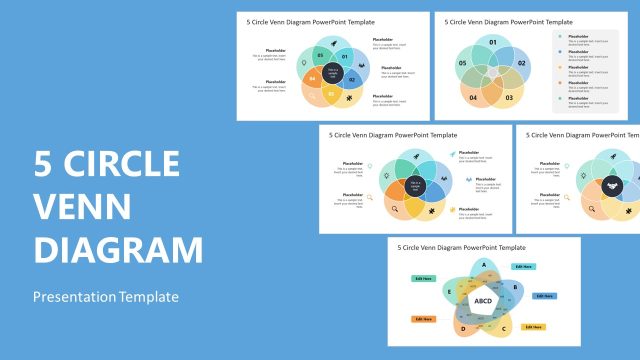
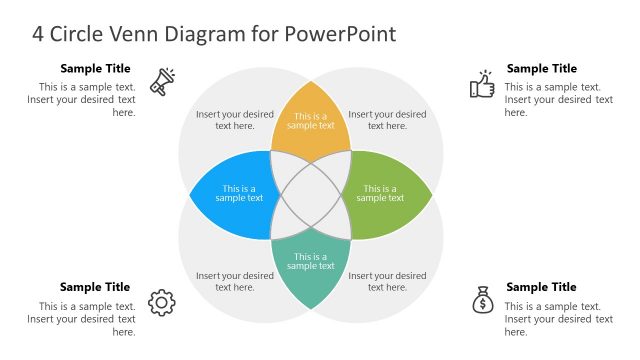
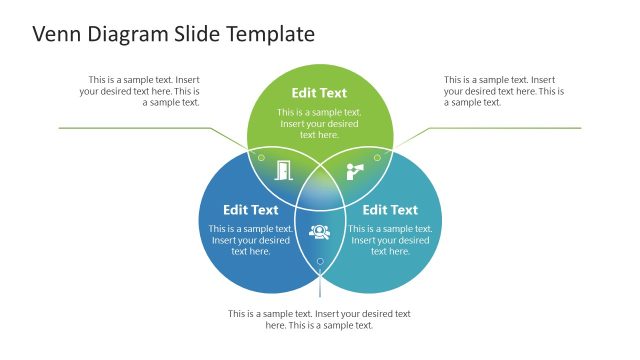
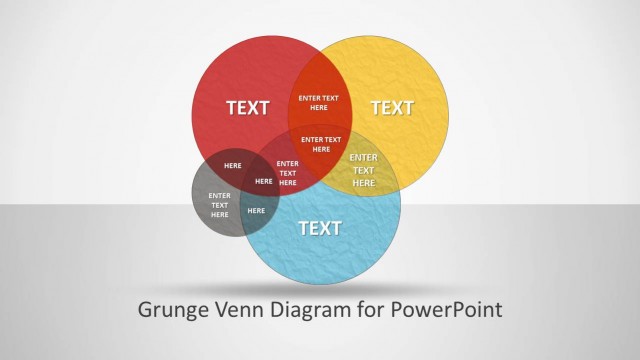
Download Colorful Venn Diagrams for PowerPoint. This template comes with colorful slide designs for making Venn Diagrams with ease. Just add text and arrange the diagram objects via drag and drop to construct professional looking Venn Diagrams in PowerPoint.
The sample slides come with multiple Venn diagram layouts where diagram objects are arranged differently in each slide. You can not only use this template for making Venn Diagrams for official or personal use but also create printable models for your projects.
What’s inside this template
Example presentation scenarios
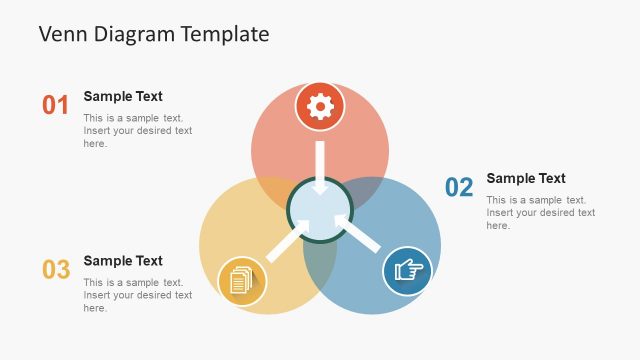
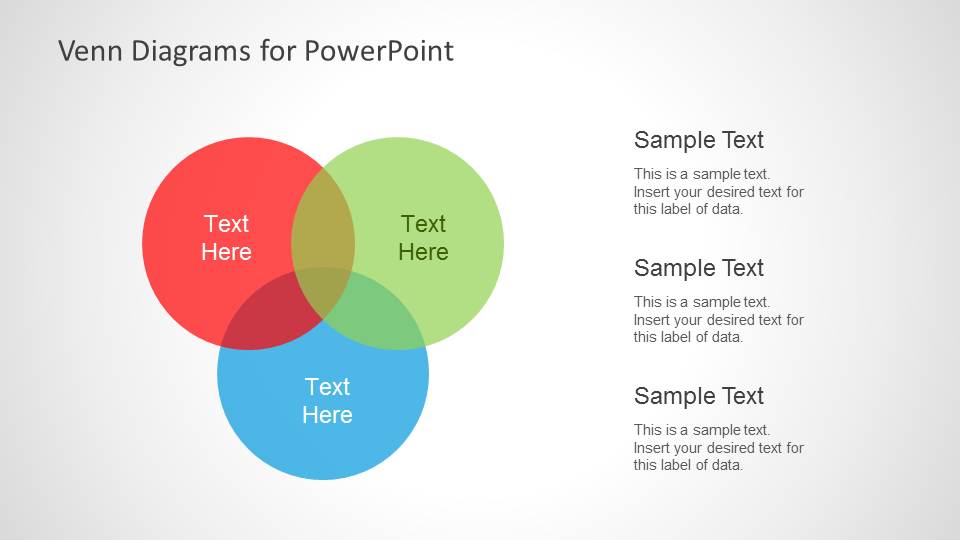
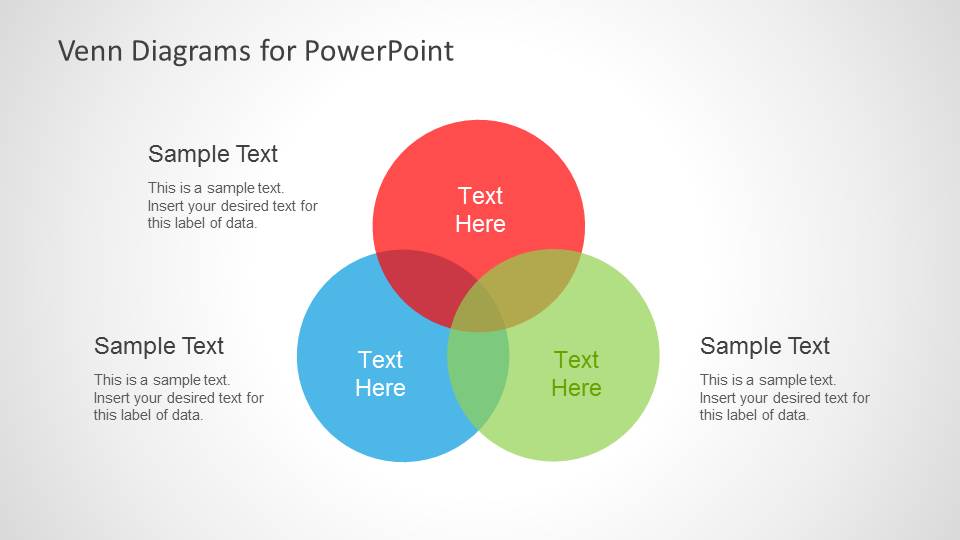
- An educator can use the three-circle Venn layouts to teach union and intersection concepts while giving students clear places to read each set label and supporting note.
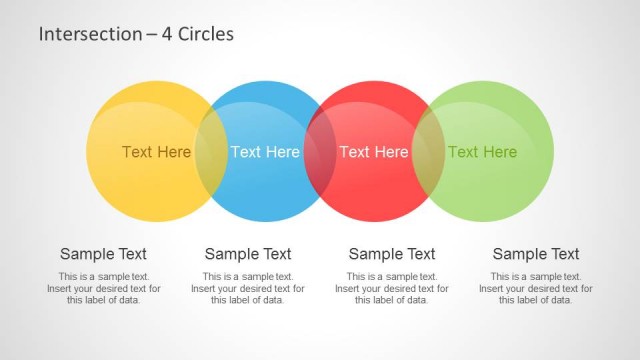
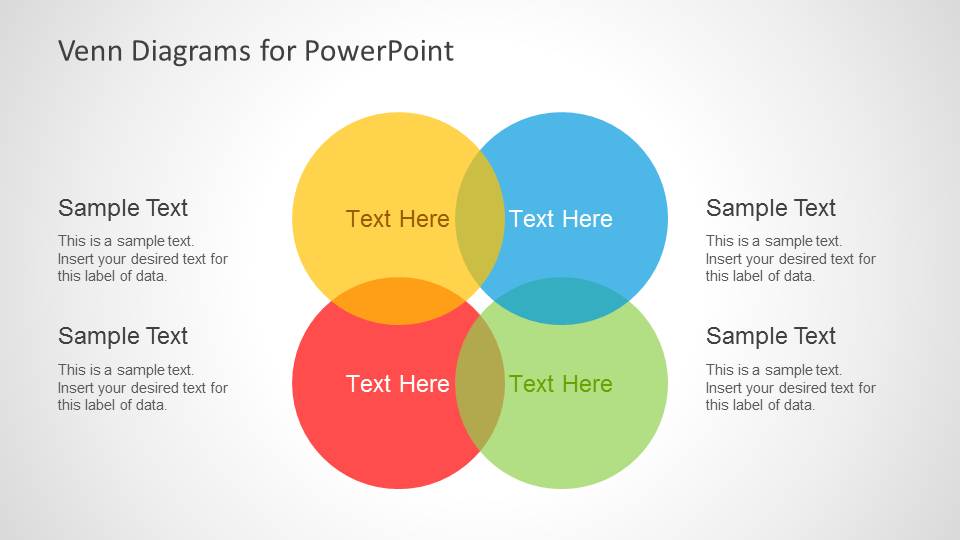
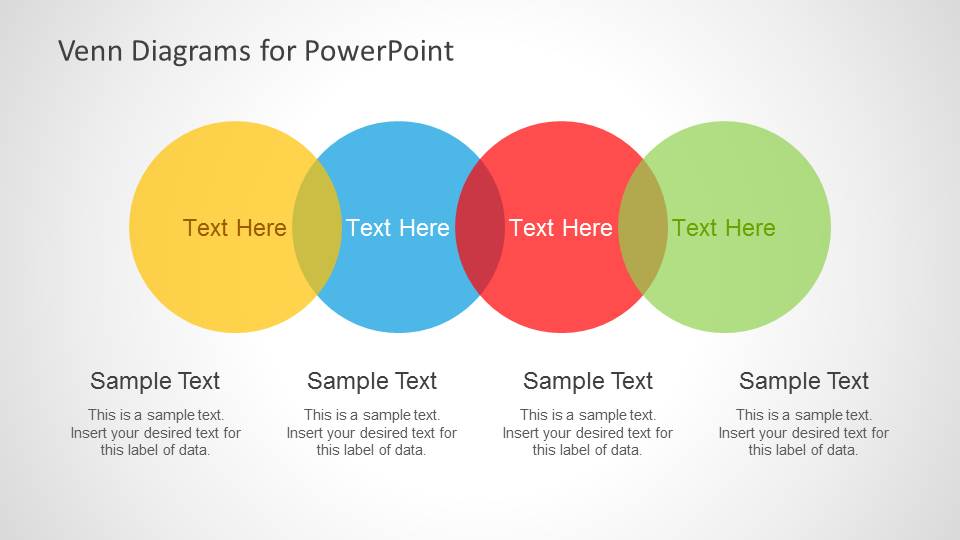
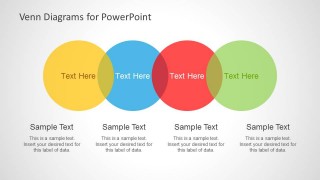
- A product manager can use the linear four-circle Venn diagram to compare feature groups, show overlap between offers, and explain where one product position meets another.
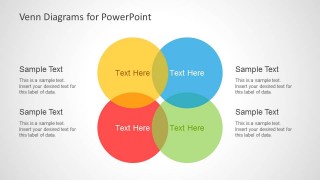
- A strategy consultant can use the four-circle quadrant Venn diagram to map overlapping capabilities, business units, or stakeholder interests during a planning workshop.
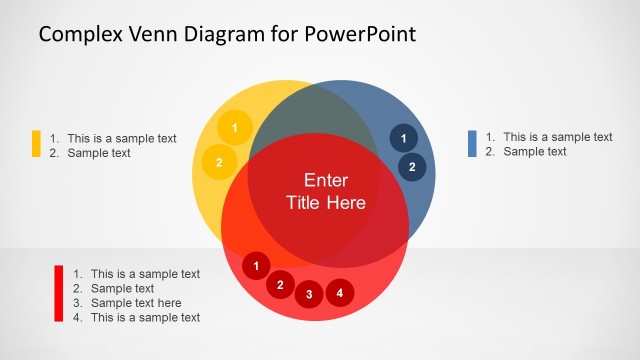
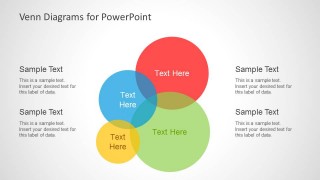
- A marketing analyst can use the uneven four-circle Venn layout to compare audience segments, note shared behaviors, and call out differences with side text blocks.
Features
- 100% editable presentation template
- Compatible with Microsoft PowerPoint and Google Slides
- 16:9 aspect ratio slides
- Scalable vector shapes, icons and illustrations
- AI-Ready for Microsoft Copilot and Claude
- Instant access and download
Frequently asked questions
Q: How should a presenter explain a Venn diagram without making the overlap areas confusing?
A: Start by naming each outer circle before discussing the shared center. On the three-circle and four-circle slides, use the circle labels for category names and reserve the surrounding text blocks for interpretation. This keeps the diagram readable and helps the audience move from individual sets to intersections step by step.
Q: Who benefits most from this template in a business or education setting?
A: This template fits presenters who need to compare categories rather than list isolated points. Educators can teach set theory or logical reasoning, while analysts and managers can show how products, audiences, services, or stakeholder groups overlap. The diagrams work best when the main message is about shared attributes.
Q: Why use overlapping circles instead of a table for this comparison?
A: The Venn metaphor makes relationships visible before the audience reads the text. The translucent circles create darker intersection zones, so shared meaning is seen immediately. A table can compare details, but these layouts help explain category logic, mutual coverage, and common ground more quickly.


Colorful Venn Diagrams for PowerPoint
6-slide presentation template with colorful Venn diagrams for set relationships and intersections
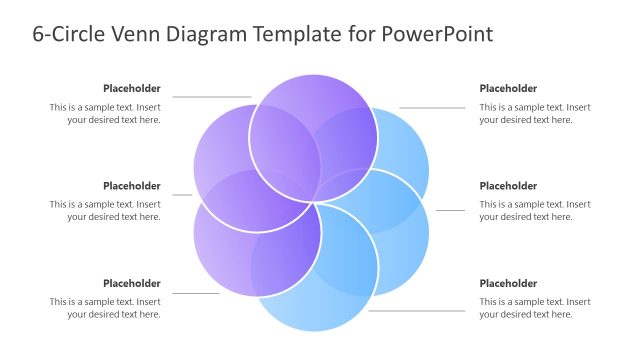
Colorful Venn Diagrams for PowerPoint is a 6-slide diagram template for explaining set relationships, overlaps, unions, and intersections. It includes three-circle cluster Venn layouts, a four-circle quadrant Venn, linear three-circle and four-circle comparison diagrams, and text callouts for educators, analysts, product teams, and business presenters in Microsoft PowerPoint and Google Slides.
- Category
- Diagrams
- Rating


 Loading...
- Aspect ratio
- 16:9
- Item ID
- 8075
- Colors
 Microsoft PowerPoint
  Microsoft Copilot
  Claude for PowerPoint
 Other formats supported
Subscribe today and get immediate
access to download our PowerPoint templates.