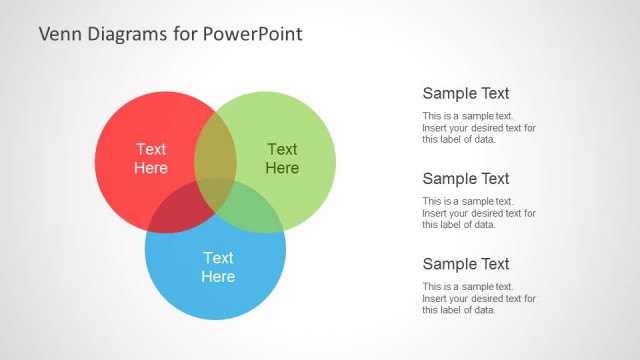
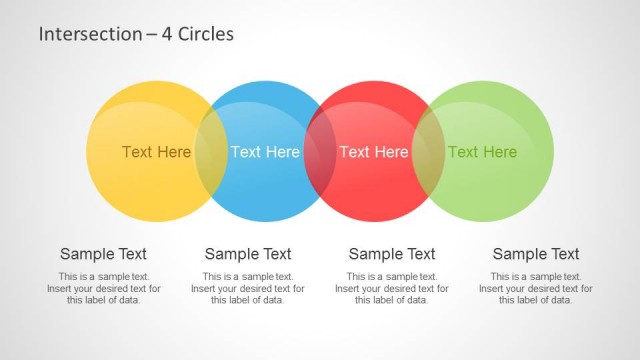
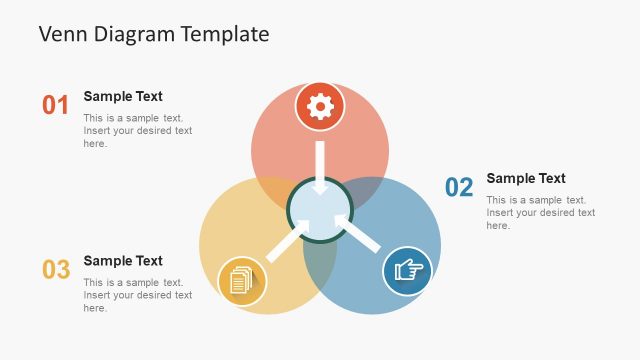
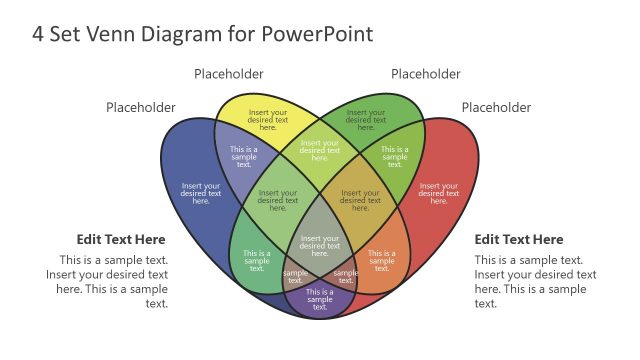
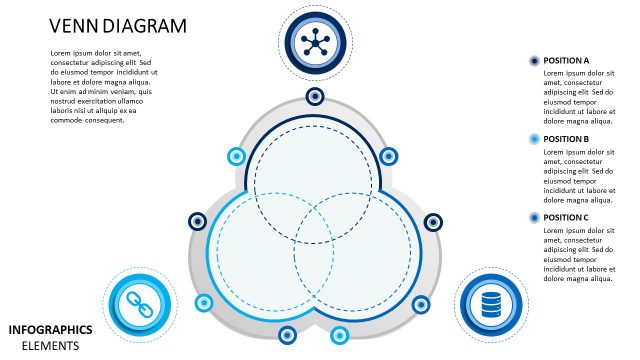
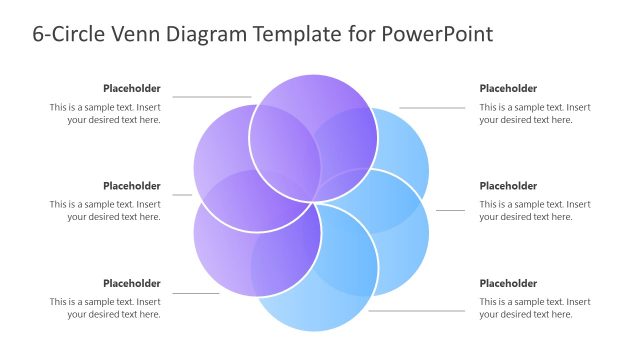
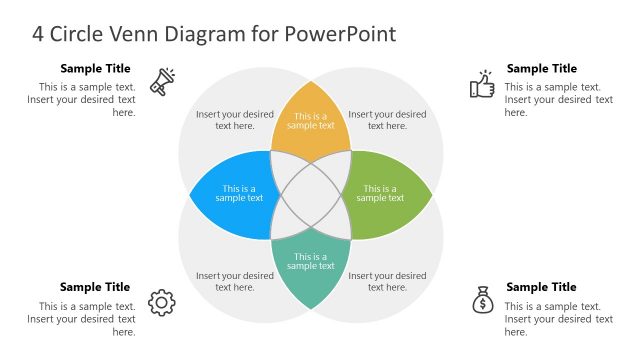
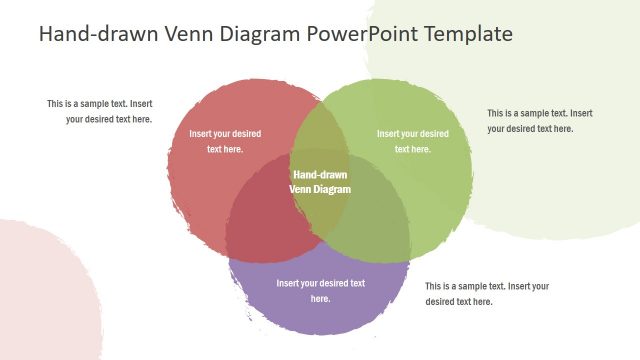
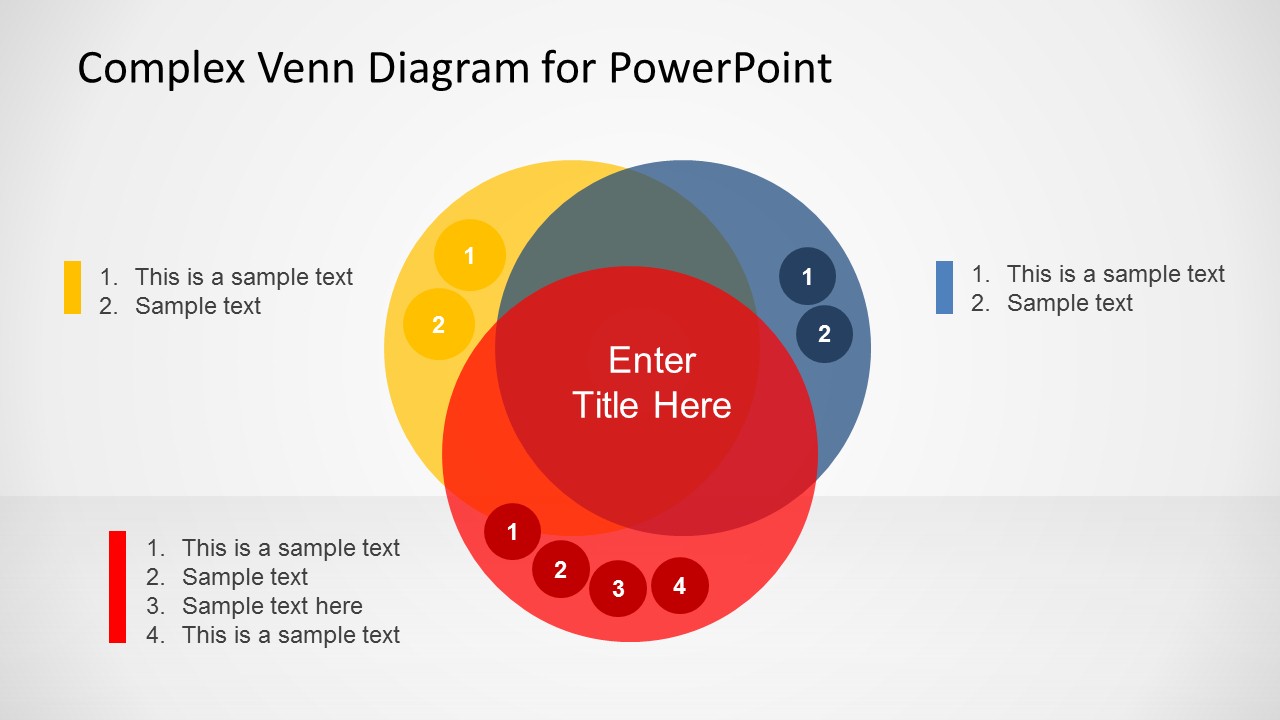
Complex Venn Diagram Design for PowerPoint is a creative Venn diagram or Set Diagram for PowerPoint that you can download for your presentations. Venn Diagram design. A Venn diagram is a diagram that shows all possible logical relations between a finite collection of sets.
Alternatively you can download other Venn diagram templates for PowerPoint presentations.
What’s inside this template
Example presentation scenarios
- A consultant can use the colorful overlapping Venn diagram to explain where client capabilities, market needs, and proposed services intersect during a strategy workshop.
- A business analyst can use the gray callout Venn slide to present relationship notes around several data categories while keeping the central overlap as the main takeaway.
- An educator can use the bubble legend layout to teach set relationships by assigning each color group to a concept and explaining the numbered examples beside it.
- A product manager can use the numbered markers and legends to compare feature groups, customer needs, and delivery priorities in a brief stakeholder update.
Features
- 100% editable presentation template
- Compatible with Microsoft PowerPoint
- 16:9 aspect ratio slides
- Scalable vector shapes, icons and illustrations
- AI-Ready for Microsoft Copilot and Claude
- Instant access and download
Frequently asked questions
Q: How should a presenter explain a complex Venn diagram without overwhelming the audience?
A: Start with the outside sets before discussing the overlap. On Slide 1, name each colored group through the side legends, then move to the central title area as the key intersection. Use the numbered markers as speaking cues so the audience follows one relationship at a time instead of scanning every circle at once.
Q: Who is this Venn diagram template best suited for?
A: It fits presenters who need to explain conceptual overlap rather than detailed calculations. Consultants, analysts, educators, and product managers can use it to compare stakeholder groups, feature clusters, service categories, or learning concepts. The three layouts support both a high-level relationship view and a callout-based explanation.
Q: Why use overlapping circles and bubble markers for this message?
A: The Venn metaphor makes shared meaning visible immediately: separated areas show distinction, while intersections show common ground. The colored circles on Slide 1 create the main logic, Slide 2 reduces color to emphasize callouts, and Slide 3 turns the same grouping idea into a legend-led explanation.


Complex Venn Diagram Design for PowerPoint
3-slide PowerPoint slide template for complex Venn comparisons, legends, and set relationships
Complex Venn Diagram Design for PowerPoint is a 3-slide diagram template for explaining set relationships and grouped comparisons. It includes a colorful overlapping Venn diagram, a gray callout Venn layout, and a bubble legend variation. The 16:9 slides use editable PowerPoint shapes for business, education, and analysis presentations.
- Category
- Diagrams
- Rating


 Loading...
- Aspect ratio
- 16:9
- Item ID
- 6543-01
- Colors
 Microsoft PowerPoint
  Microsoft Copilot
  Claude for PowerPoint
 Other formats supported
Subscribe today and get immediate
access to download our PowerPoint templates.