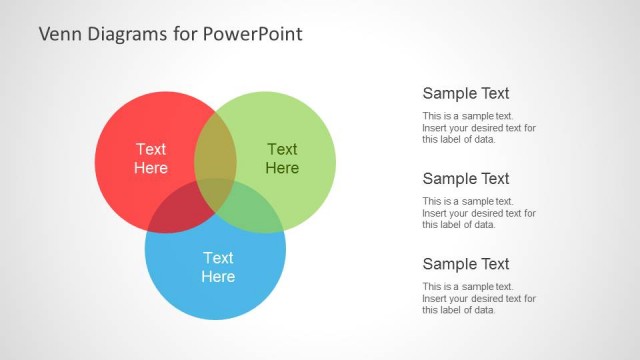
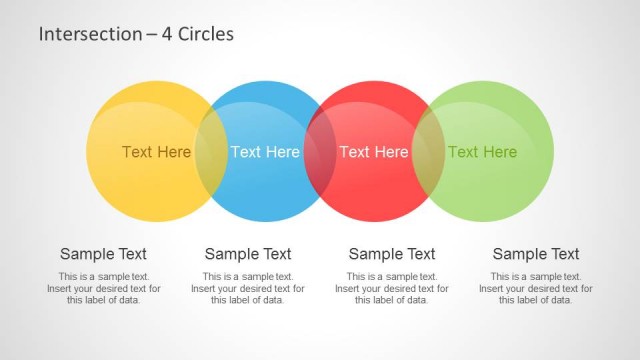
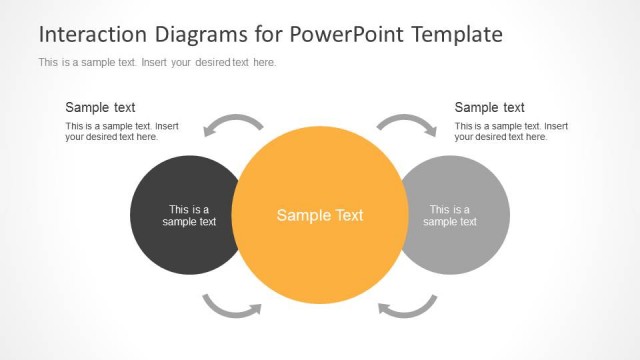
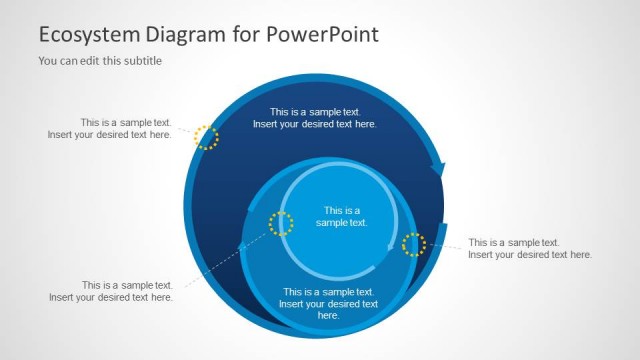
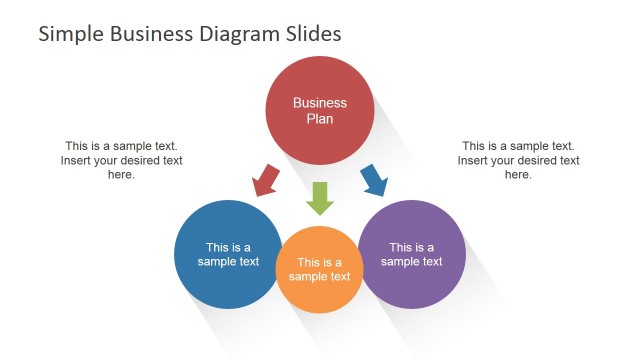
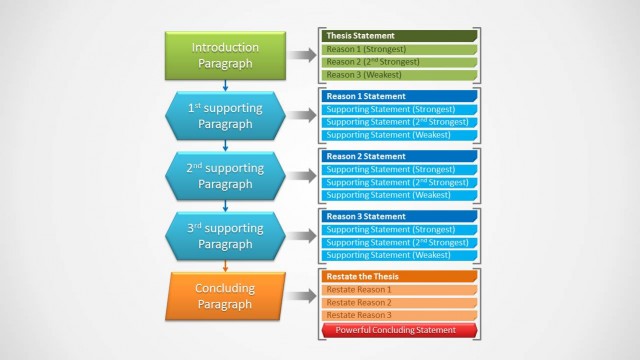
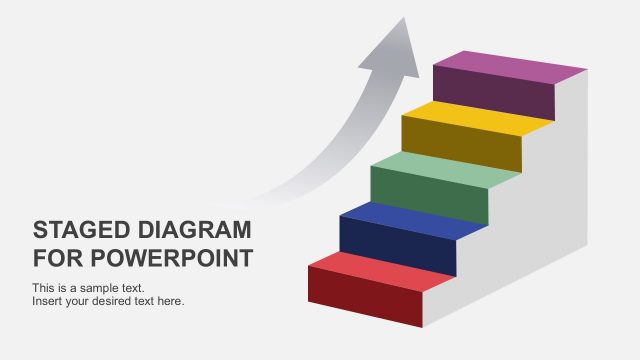
Simple Euler Diagrams for PowerPoint is a slide set for making Euler Diagrams. The sample slide designs are easy to customize and you can create a professional looking diagram by merely adding text to the sample slides.
This diagram template for PowerPoint can also be comprehensively customized by changing the size and color of the objects. You can also rearrange the objects within the given slides and make use of connectors to create elaborate Euler Diagrams.
What’s inside this template
Example presentation scenarios
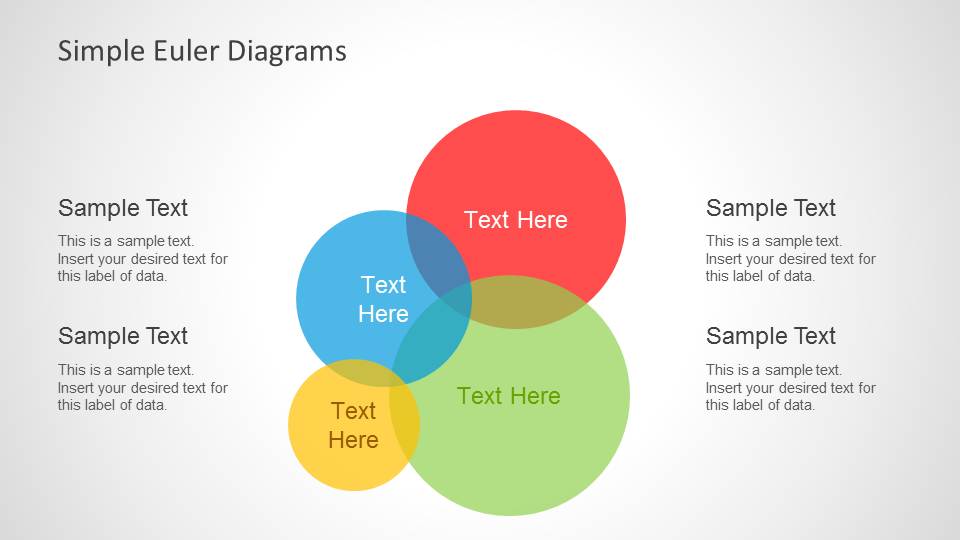
- A business analyst can use the clustered overlapping-circle layout to explain how customer groups, product needs, or market segments intersect during a strategy discussion.
- A consultant can use the connector-based Euler diagram to show relationships among initiatives, stakeholders, or decision factors while keeping explanatory notes separate from the main visual.
- An educator or trainer can use the colored set circles and side text blocks to teach category membership, shared traits, and exceptions in a short lesson.
- A product manager can use the overlapping circles to compare features, user groups, or service tiers and clarify which items belong to more than one category.
Features
- 100% editable presentation template
- Compatible with Microsoft PowerPoint and Google Slides
- Scalable vector shapes, icons and illustrations
- AI-Ready for Microsoft Copilot and Claude
- Instant access and download
Frequently asked questions
Q: How should a presenter explain a relationship clearly with these Euler diagrams?
A: Start by naming each circle as a distinct group before discussing any overlap. Use the side text blocks for definitions or criteria, and reserve text inside the circles for short labels. On the connector slide, make each callout point to one specific relationship so the audience can follow the logic without reading long copy.
Q: Who is this template best suited for?
A: This template fits analysts, consultants, educators, and product teams that need to explain conceptual overlap rather than present numeric performance. It works well for audience segments, feature sets, capabilities, stakeholder groups, or learning topics where the main task is to show membership, intersection, and separation at a glance.
Q: Why use overlapping circles instead of a list or table?
A: The overlapping-circle metaphor makes relationships visible before the audience reads the details. A list can identify categories, but it does not show shared space. These Euler layouts place related ideas near or inside one another, helping the presenter explain inclusion, partial overlap, and distinct groups with less verbal setup.
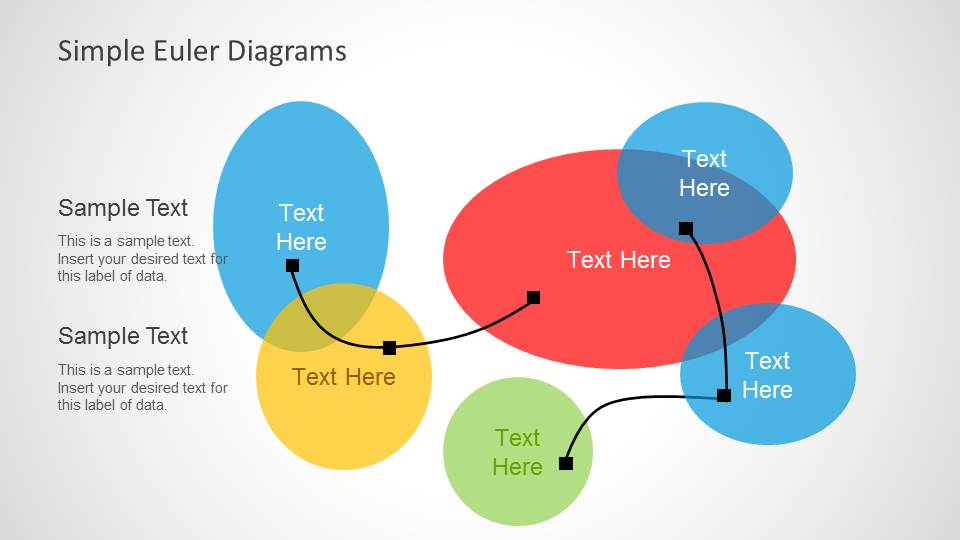
Simple Euler Diagrams for PowerPoint
2-slide presentation template for Euler diagrams, set relationships, and overlapping circle visuals
Simple Euler Diagrams for PowerPoint is a 2-slide diagram template for explaining set membership and relationships with colored overlapping circles. It includes one connected callout Euler diagram and one clustered overlap layout with side text notes. It is intended for presenters who need editable relationship visuals in PowerPoint.

 Loading...
 Microsoft PowerPoint
  Microsoft Copilot
  Claude for PowerPoint
 Other formats supported
Subscribe today and get immediate
access to download our PowerPoint templates.