Financial PowerPoint Template with Calculator is a financial presentation and slide design that you can use to make presentations in Microsoft PowerPoint.
Inside this financial PowerPoint template you will find some useful cliparts like calculator shapes created with PowerPoint as well as coins and world maps. You can use this template also in presentations on accounting.
In order to use this template you need to install the freeware font Pocket Calculation by BVFonts.
What’s inside this template
Example presentation scenarios
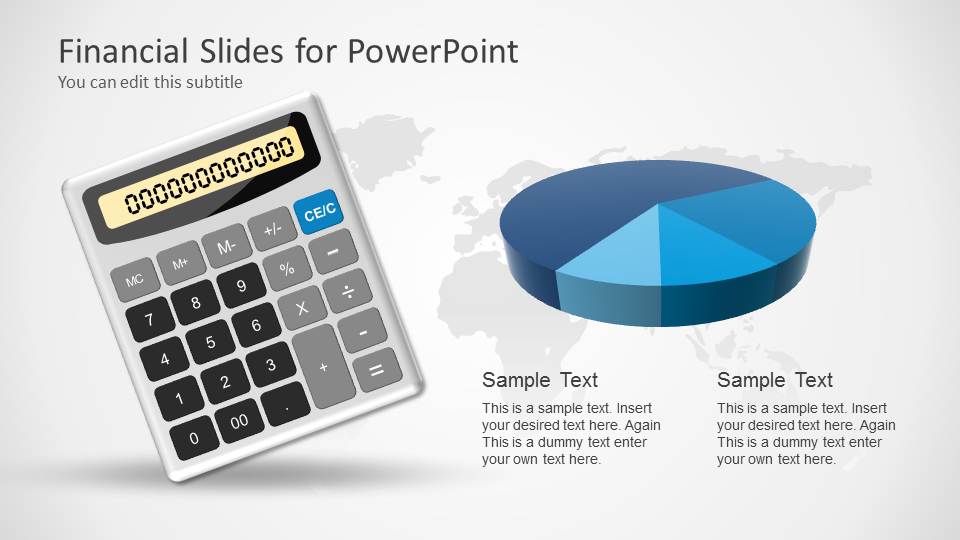
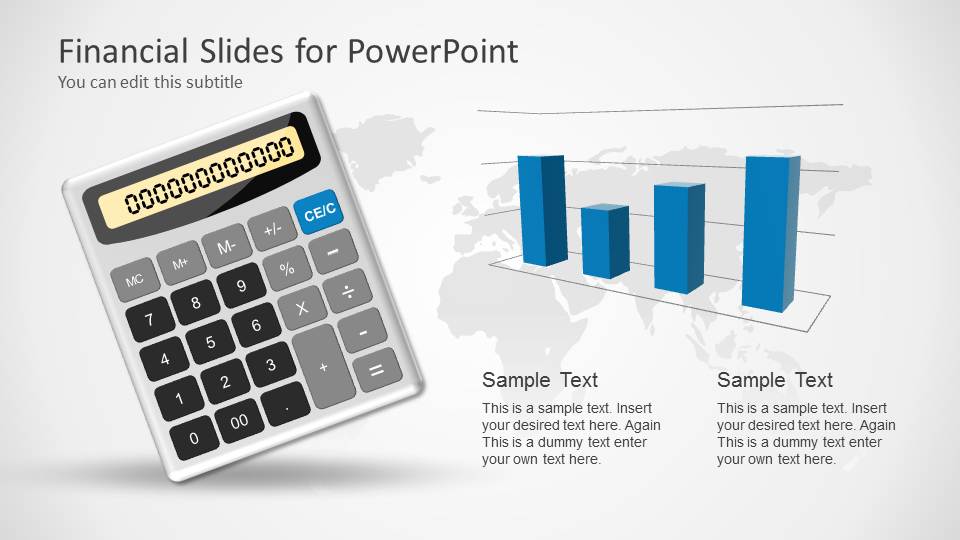
- A finance manager can use the pie chart and column chart slides to report how a budget is distributed and where major spending categories changed.
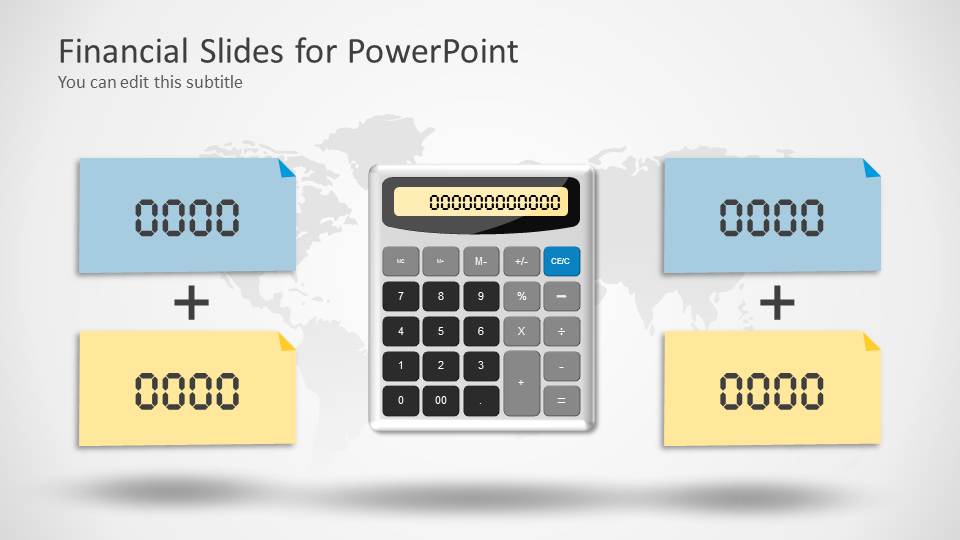
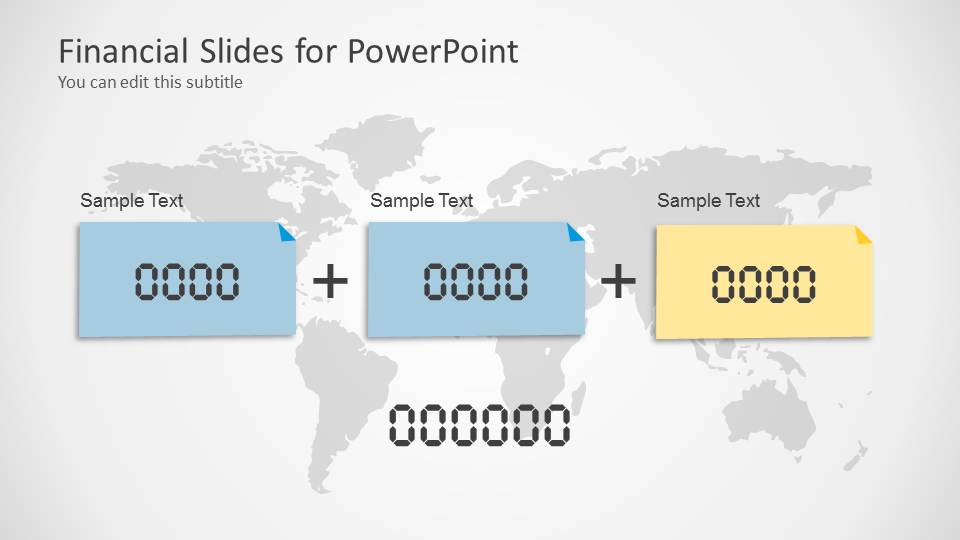
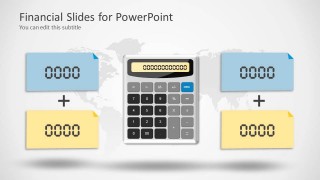
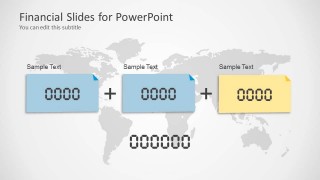
- An accountant can use the sticky-note addition layouts to explain a tax, invoice, or expense total in a way nonfinancial stakeholders can follow.
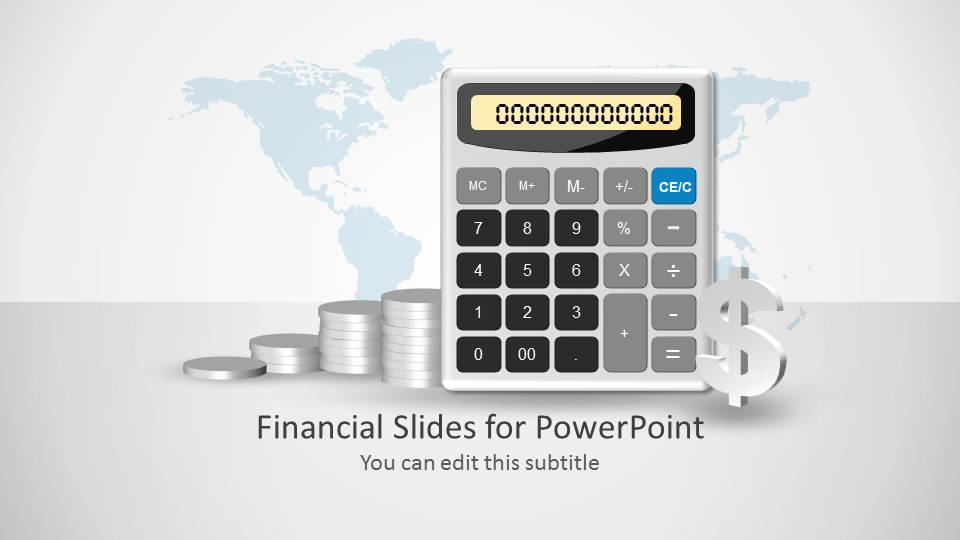
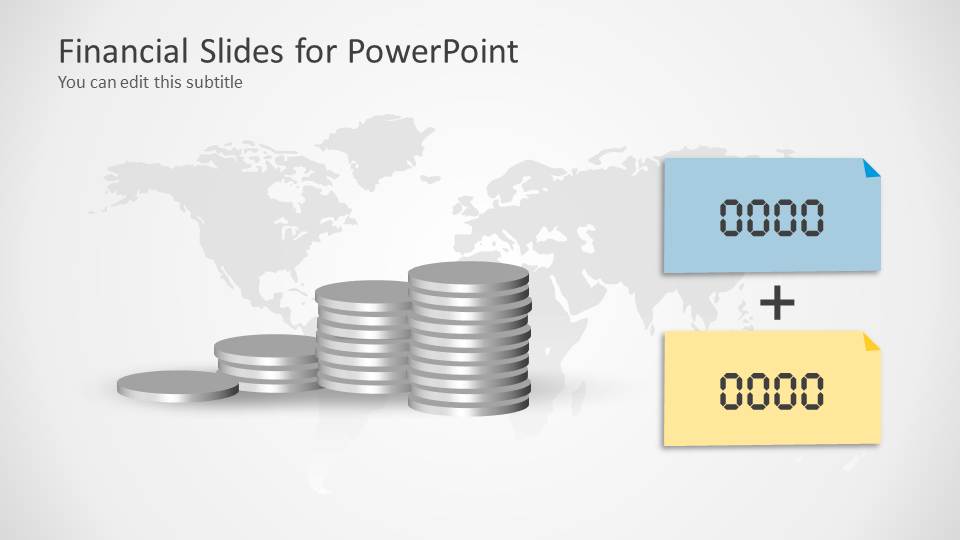
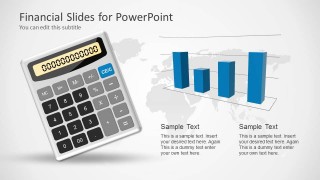
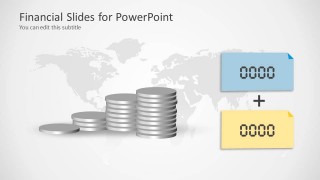
- A consultant can use the calculator cover and coin stack slide to frame a client cost-saving discussion before showing the final calculation.
- A business analyst can use the notes slide to summarize assumptions, open items, or next-step financial actions after presenting the chart slides.
Features
- 100% editable presentation template
- Compatible with Microsoft PowerPoint and Google Slides
- Scalable vector shapes, icons and illustrations
- AI-Ready for Microsoft Copilot and Claude
- Instant access and download
Frequently asked questions
Q: How should a presenter organize a short finance update with this template?
A: Start with the calculator cover to define the financial question, then use the pie chart for composition and the column chart for comparison. Follow with the sticky-note addition slides to show how the numbers combine. End with the notes slide to capture assumptions, decisions, or follow-up actions.
Q: Who is this template best suited for in a business setting?
A: It fits finance managers, accountants, analysts, and consultants who need to explain a calculation rather than present a dense spreadsheet. The calculator, coins, sticky notes, and chart layouts work best for budget summaries, fee breakdowns, expense explanations, or simple financial training for business audiences.
Q: Why use calculator and sticky-note metaphors for financial communication?
A: The calculator signals arithmetic and accountability before the audience sees any numbers, while the sticky notes make individual inputs feel separate and easy to combine. This visual metaphor reduces the intimidation of finance content and helps the presenter walk through a total step by step.

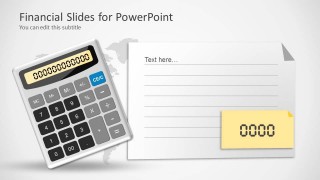
Financial PowerPoint Template with Calculator
7-slide financial presentation template with calculator visuals, charts, coins, and accounting calculation layouts
The Financial PowerPoint Template with Calculator is a 7-slide finance presentation template built for PowerPoint. It includes a calculator cover, pie chart, column chart, sticky-note calculation layouts, coin stack graphic, world map background, and lined note page for accounting, budgeting, reporting, or financial summary presenters.
- Category
- Business PowerPoint Templates
- Rating

 Loading...
- Item ID
- 6107-01
- Colors
 Microsoft PowerPoint
  Microsoft Copilot
  Claude for PowerPoint
 Other formats supported
Subscribe today and get immediate
access to download our PowerPoint templates.