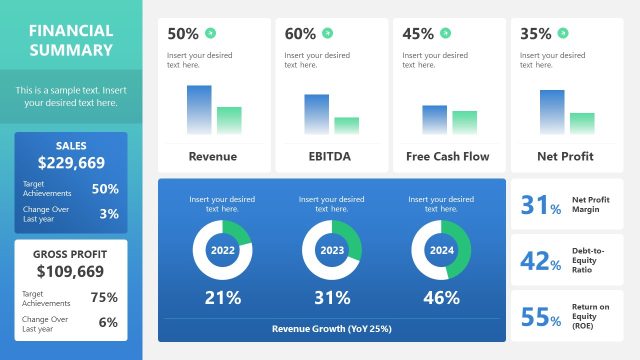
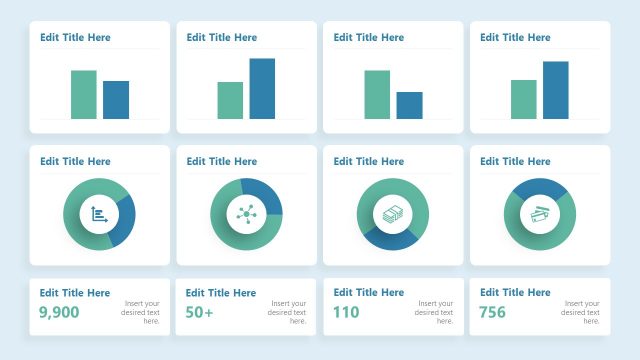
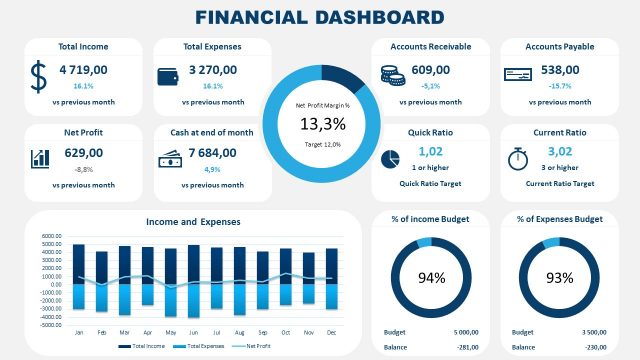
Financial Projections & Key Metrics Template for PowerPoint is a presentation template containing useful table slides in PowerPoint that you can use to present financial projections using Microsoft PowerPoint 2010 and 2013. The financial projections PowerPoint template and Key Metrics slide design let you present financial data in an organized way.
Given that the slide designs uses PowerPoint tables with summarized data like Expenses, Revenue and Cash Flow totals it is easier to understand than other complex tables. Moreover, the elegant styles used to decorate the table makes it look better than default table styles used in PowerPoint.
The financial template for PowerPoint comes with tables prepared to present 5 year projection plans, 4 year projection, 3 year projections and 2 year projections.
What’s inside this template
Example presentation scenarios
- A startup founder can use the 5-year projection table to brief potential investors on expected customers, revenue, expenses, and cash flow while emphasizing the final-year metric.
- A CFO can use the 2-year or 3-year projection table to compare near-term budget assumptions for an executive team and point to the highlighted cash flow result.
- A finance analyst can use the 4-year projection table to explain medium-term expense growth, revenue growth, and customer targets during a planning workshop.
- A department head can use the bottom key metrics area to connect a forecast table to a short profit, percentage, or customer-count takeaway for budget owners.
Features
- 100% editable presentation template
- Compatible with Microsoft PowerPoint and Google Slides
- Scalable vector shapes, icons and illustrations
- AI-Ready for Microsoft Copilot and Claude
- Instant access and download
Frequently asked questions
Q: How should I present the projection table without overwhelming the audience?
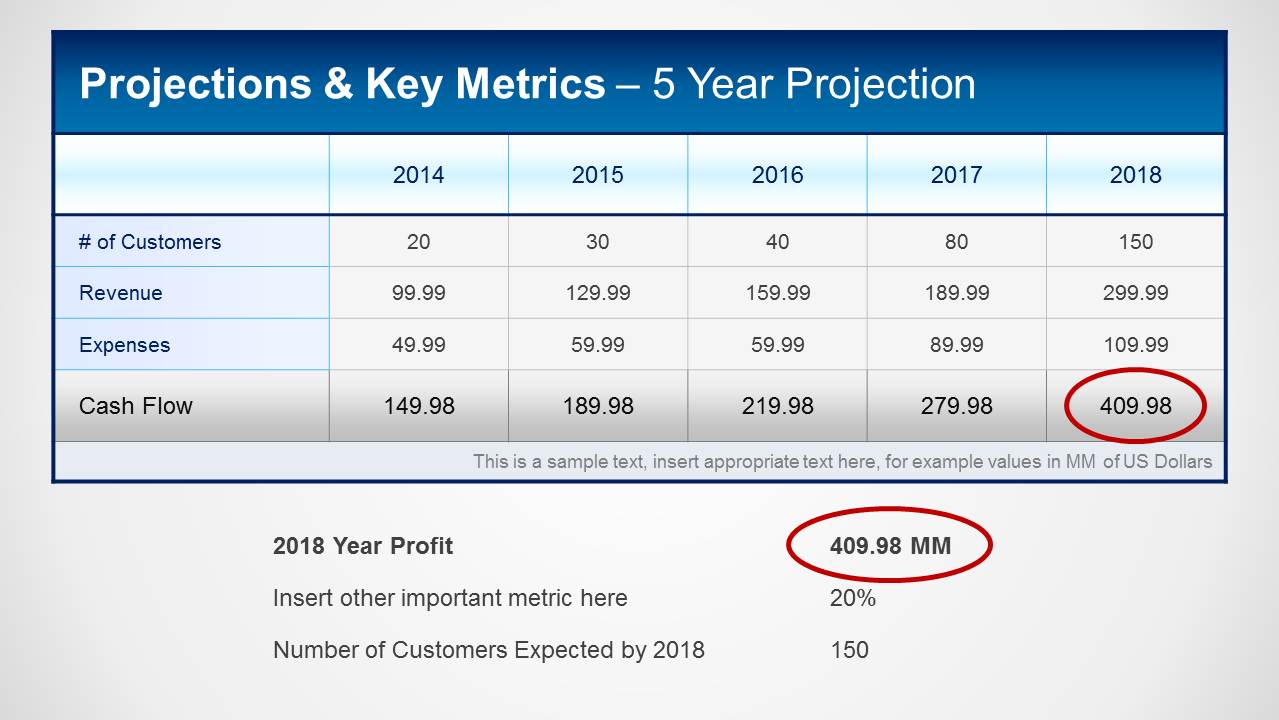
A: Start by stating the projection horizon, then move row by row through customers, revenue, expenses, and cash flow. Do not read every number. Use the red oval callout or bottom key metrics to anchor the conclusion, such as final-year cash flow or profit, and explain the main assumption behind that outcome.
Q: When is this table format a better choice than a full financial model?
A: This template fits executive, investor, or budget discussions where the presenter needs to show the forecast logic without exposing every spreadsheet detail. The 2-year through 5-year layouts help match the depth of the conversation, from near-term operating planning to a higher-level long-range projection.
Q: Why does the design repeat the same table structure across different time horizons?
A: The repeated structure reduces cognitive effort because the audience learns the row order once, then can focus on the changing time horizon. The blue title band names the projection period, the grid supports comparison, and the bottom metric area separates the main takeaway from the supporting numbers.


Financial Projections & Key Metrics Template for PowerPoint
5-slide PowerPoint presentation template for financial projections, revenue tables, expenses, and cash flow metrics
Financial Projections & Key Metrics Template for PowerPoint is a 5-slide table-based presentation template for reporting revenue, expenses, customer counts, and cash flow. It includes 2-year, 3-year, 4-year, and 5-year projection table layouts with bottom key metric summaries and highlight callouts for finance teams, founders, and executives.


 Loading...
 Microsoft PowerPoint
 Microsoft Copilot
 Claude for PowerPoint
Other formats supported
Subscribe today and get immediate
access to download our PowerPoint templates.