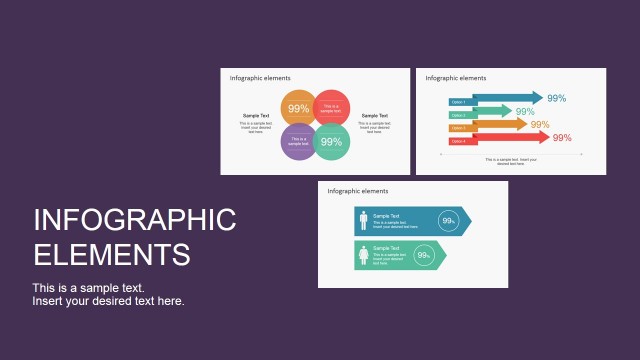
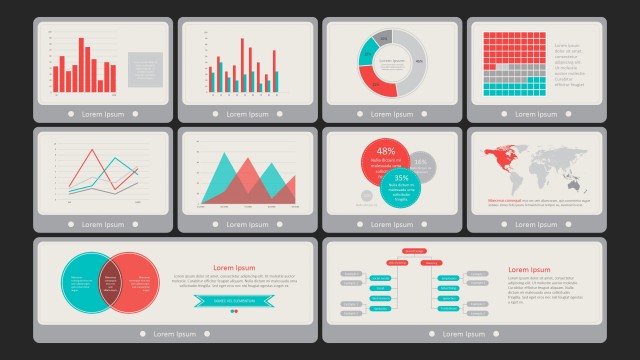
Flat Infographic Charting Elements for PowerPoint
Flat Infographic Charting Elements for PowerPoint provides an 8-slide infographic for presentation. This professional PowerPoint template is a gallery of flat infographic data elements and charts ideal for creating infographics and data presentations.
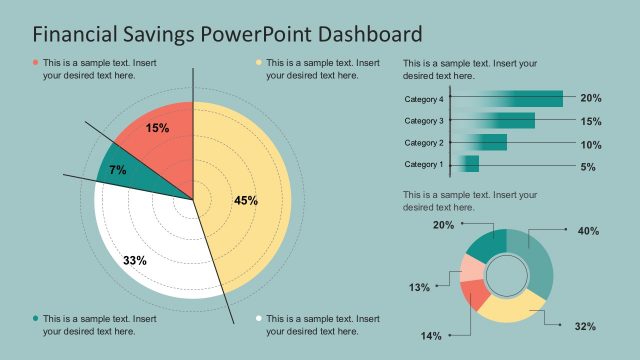
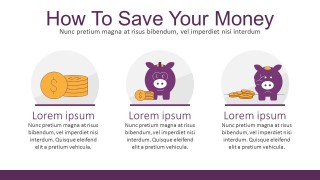
The PowerPoint slides are simultaneously visually appealing and interactive. It effectively highlights money-saving techniques and tools to keep an eye. By merely looking at the data elements, you can easily analyze the financial trends. This is not only effective for commercial, but for personal use.
Look at how the PowerPoint Slides are effectively interconnected with these focus areas:
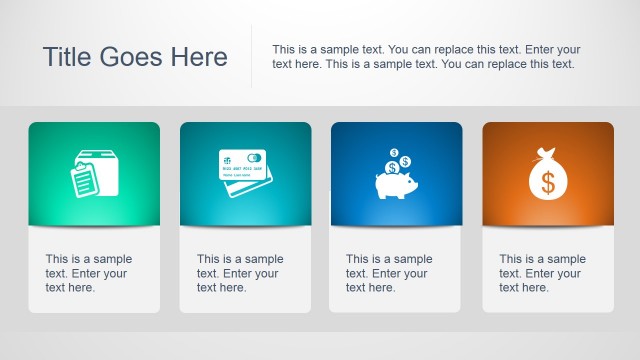
- How to Save Your Money
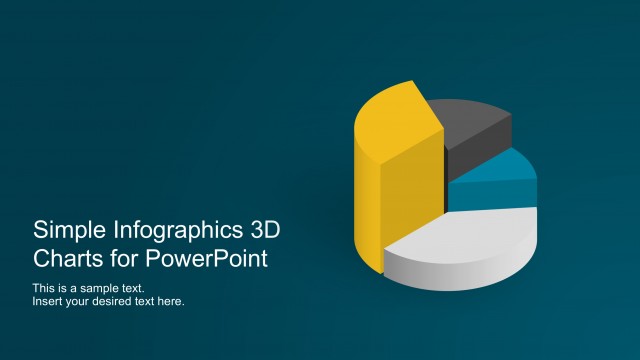
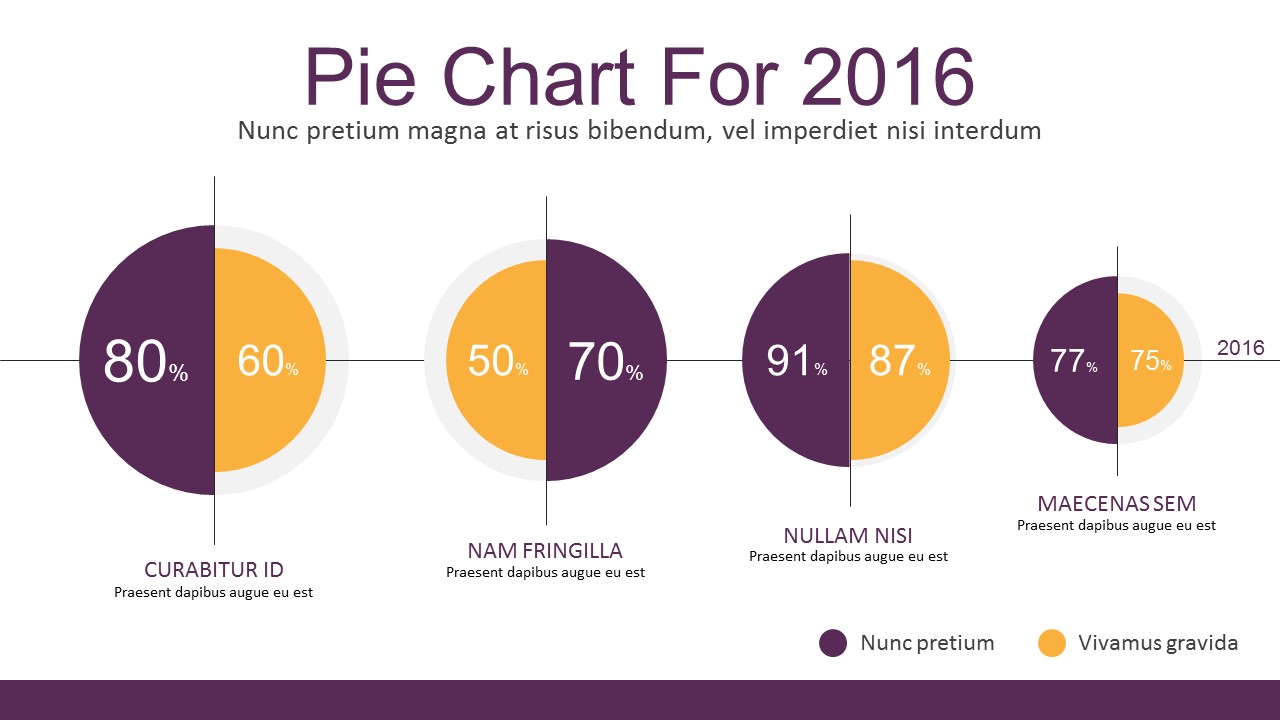
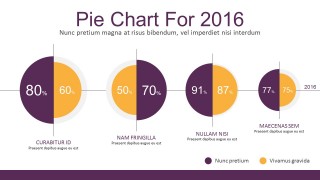
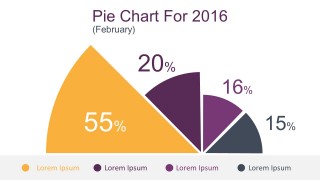
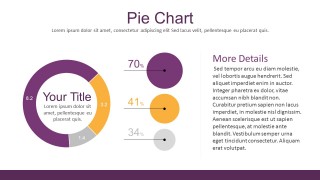
- Pie Chart with data comparisons
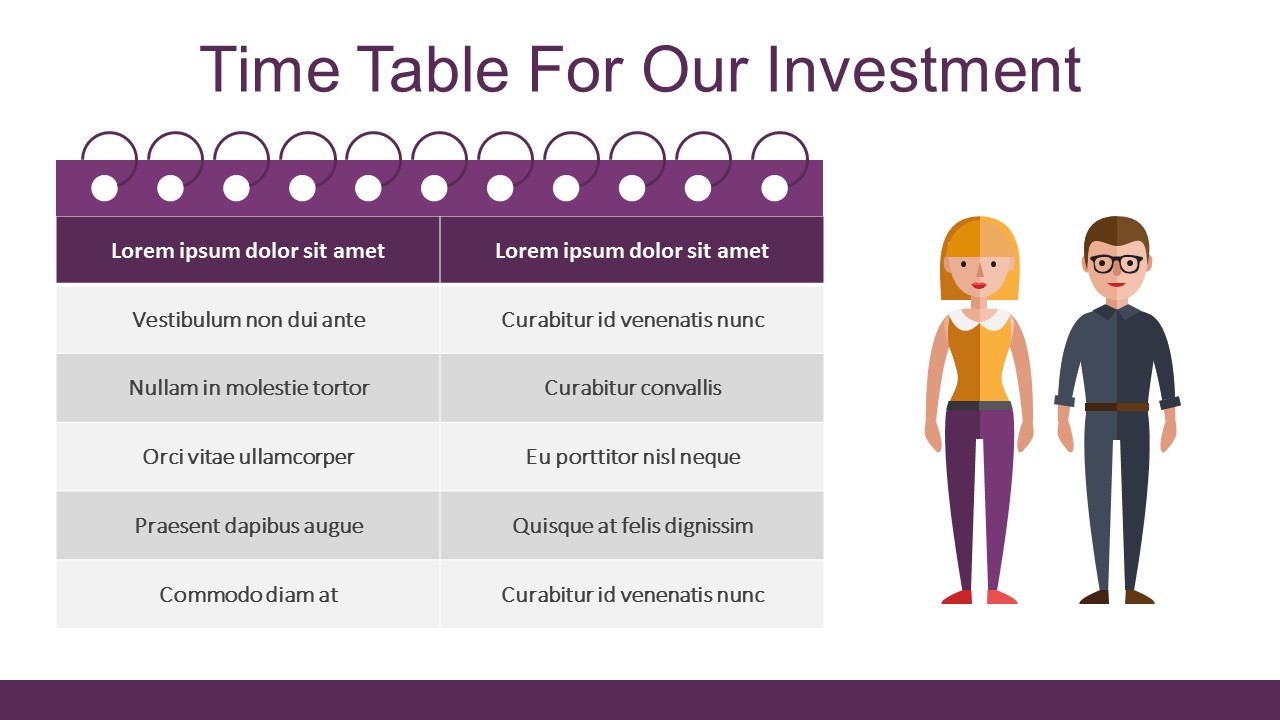
- Timetable for Business Investments
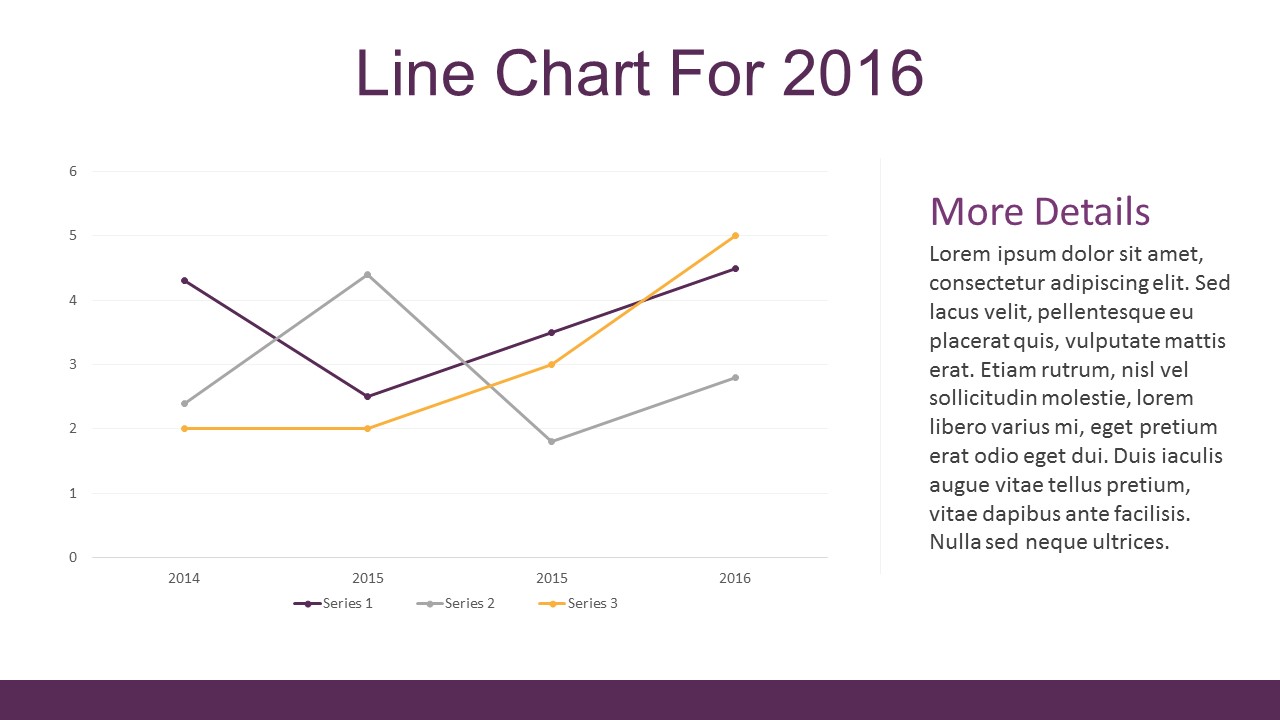
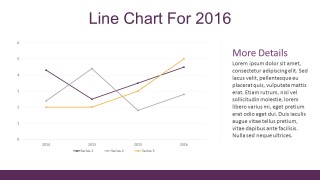
- Annual Investment Line Chart
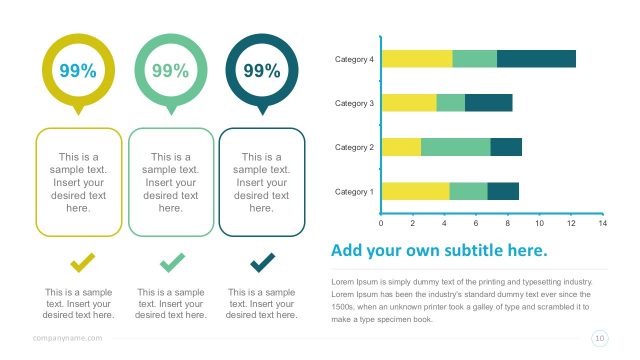
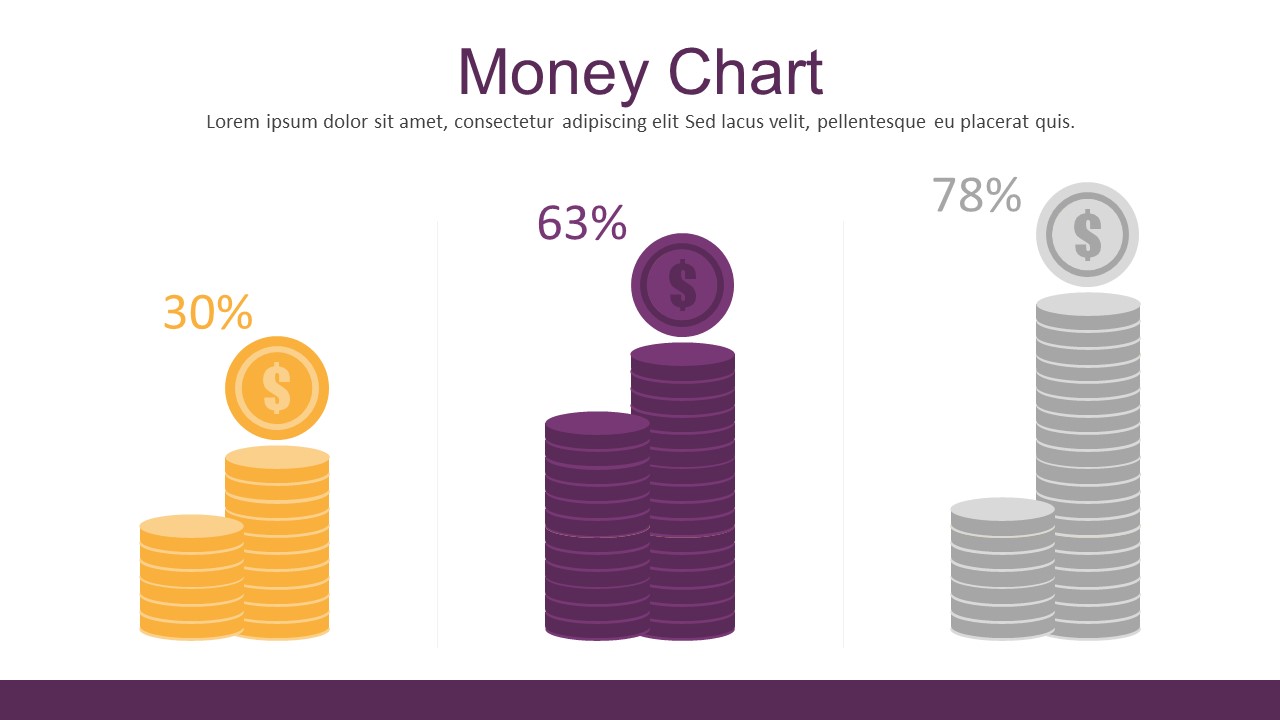
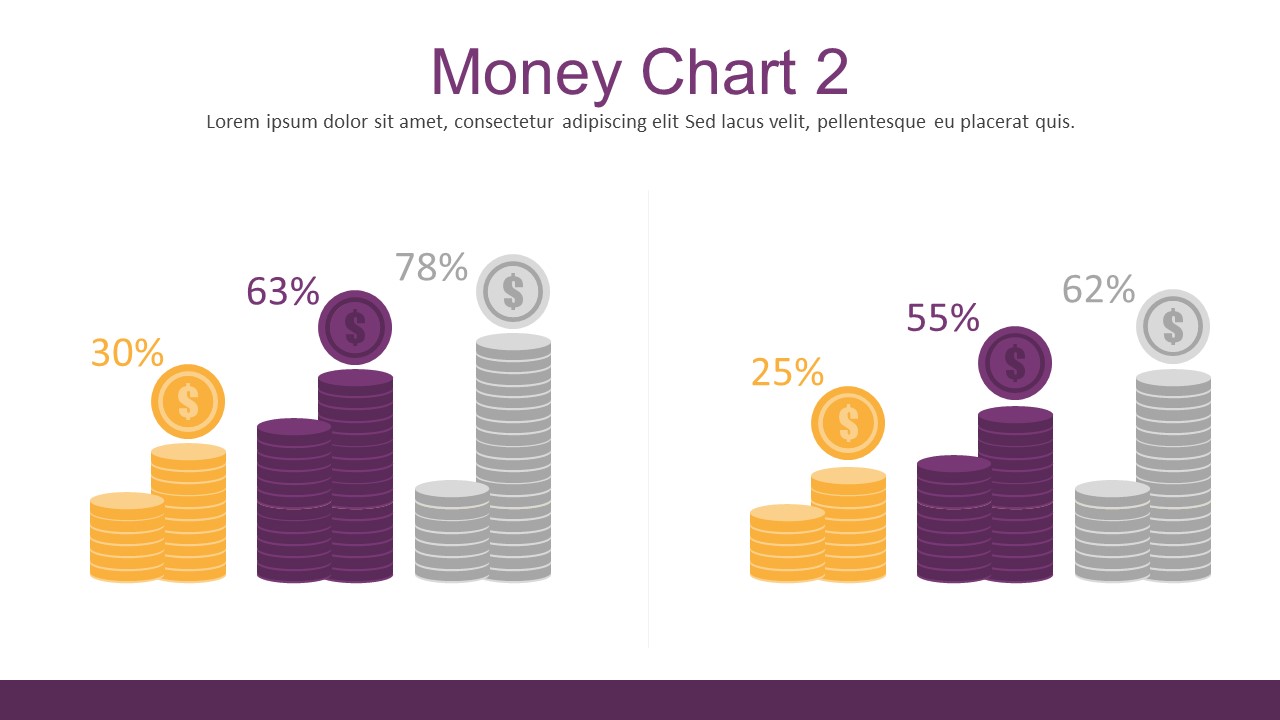
- Money Chart and Cash Flow Statistics
Specifications:
- Flat Infographic Charting Elements for PowerPoint
- Color Scheme: Violet and Gold tones on white background
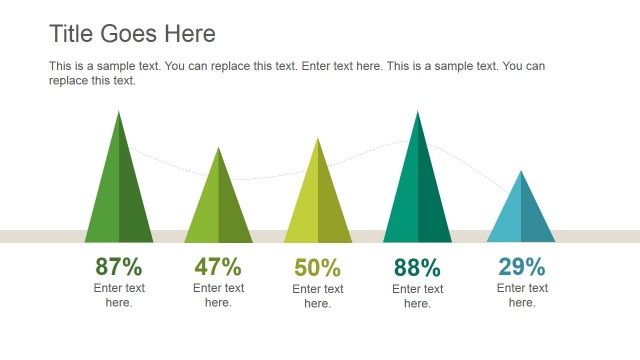
- Graphics: Flat Designs, Shapes, Infographics, Characters, Charts and Graphs
- Features: Editable PowerPoint Vectors: colors, text, shapes
This infographic for PowerPoint will help you visualize financial information that needs to be quickly understood for decision making or optimization. Additionally, the PowerPoint slides are often utilized in creating complex conclusions over data for information in a simpler manner. Alternatively, you can download other professional PowerPoint templates for presentations combining different infographic elements and creative slide layouts.
This Flat Infographic Charting Elements for PowerPoint will help you visualize business figures and make your business PowerPoint presentation compelling with little to no effort.


You must be logged in to download this file.
DOWNLOAD- Category
- Shapes
- Rating


 Loading...
- Size
- 16x94x3
- Item ID
- 0052-01
- Colors
Subscribe today and get immediate
access to download our PowerPoint templates.