Slide 2 of 7 from Financial PowerPoint Template with Calculator
6107-01-financial&accounting-shapes-2
Calculator and Pie Chart Financial Slide
- Media Layout
- Other
- Financial Summary Slide
- 16:9
- 100% Editable
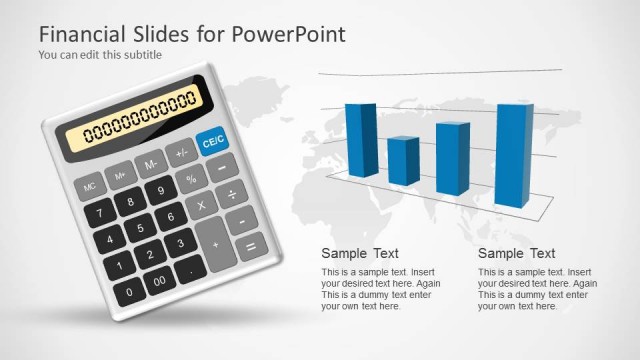
The Calculator and Pie Chart Layout from the Financial PowerPoint Template with Calculator offers a clear financial summary slide ideal for business presentations. This slide template combines editable shapes like a calculator and a segmented pie chart to visualize budget analysis and financial data effectively. Its design supports concise communication in corporate presentations and pitch deck templates, making it a practical choice for financial overviews and data-driven storytelling.
What’s on This Slide
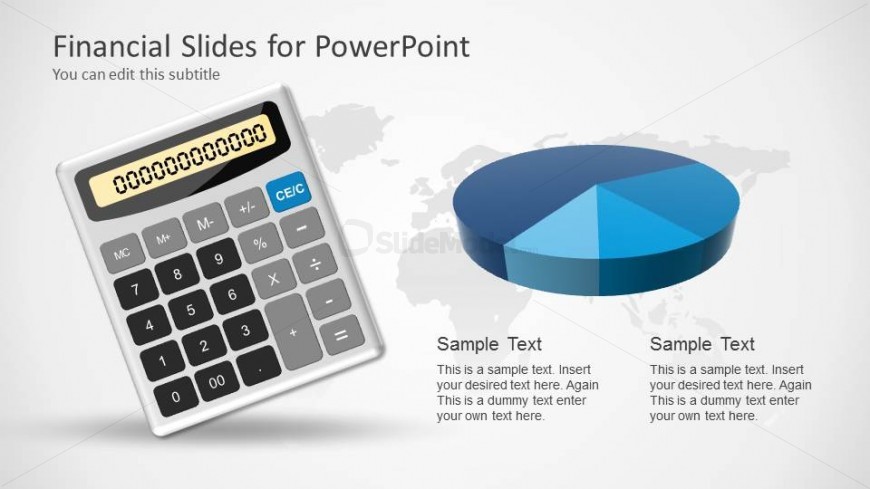
The layout features a calculator positioned on the left side, occupying a vertical space. To the right, a pie chart is displayed, showcasing a segmented circular shape with three distinct sections. Below the pie chart, there are two text placeholders aligned horizontally, each designated for sample text. The background is light with a subtle world map graphic, enhancing the financial theme. The calculator has visible buttons and a digital display, while the pie chart is rendered in shades of blue, creating a cohesive color scheme. The overall composition emphasizes the calculator and pie chart as primary visual elements.
How to Use It
This layout serves as a financial overview slide, ideal for presenting numerical data alongside visual representations. It fits well in a sequence following a problem slide, providing a solution or analysis. Suitable for business scenarios such as budget presentations, financial summaries, or accounting reports, it allows for clear communication of financial data. The combination of a calculator and pie chart effectively conveys quantitative information, making it useful for stakeholders needing concise financial insights.
Text Placeholders & Capacity
Keep your copy within these limits so it fits without resizing. Node body slots can accommodate roughly 15-20 words each.
| Placeholder | Count | Max characters (approx.) |
|---|---|---|
| Slide title | 1 | 40 |
| Subtitle | 1 | 40 |
| Item body | 2 | 100 |
Slide Keywords
Download unlimited PowerPoint templates, charts and graphics for your presentations with our annual plan.
DOWNLOAD