
Metrics give structure to ideas. They translate actions, outcomes, and goals into measurable form, allowing an audience to see what words alone can’t. Yet numbers themselves are inert. They gain meaning only when interpreted. A presenter’s task isn’t to show data but to communicate significance. The power of metrics lies in how they shape perception, not in how many digits they contain.
Every audience experiences a degree of uncertainty before the presenter begins. They don’t yet know whether to trust what they’re about to see. Clear, well-presented metrics resolve that uncertainty. When data are coherent and visually balanced, they signal competence and preparation. The audience perceives discipline behind the information. Conversely, if figures appear disorganized or detached from a logical thread, credibility erodes before the message even begins to land.
Effective presenters treat metrics as a language. They think in terms of statements, not charts. Each metric becomes a sentence in the story they’re telling. A number should never appear on a slide without an implicit answer to why it matters. In this article, we’ll explore different ways to present key metrics on slides. How to extract their communicative potential and how to get data to shape decision outcomes.
Defining Which Metrics are Key
Not every number is relevant. Quantity does not equal quality, and that’s why presenters ought to cull what truly matters to understand the context and what’s appropriate to the audience. The term key metrics implies a process of exclusion: choosing only those figures that define progress or performance in relation to the presentation’s objective.
Begin with intent. Ask: What is the purpose of this presentation? If the goal is to report quarterly progress, key metrics focus on efficiency, costs, and milestones achieved. In an academic defense, presenting key metrics may assess hypothesis validation or methodological reliability. In an NGO’s performance metrics, they might track impact per dollar or the number of beneficiaries reached. The same dataset will generate different “key” metrics depending on what the audience values.
To identify them, consider three filters: relevance, measurability, and interpretability.
- Relevance ensures the metric connects directly to the core theme.
- Measurability guarantees that data can be verified.
- Interpretability means the audience can understand it without expert background knowledge.
When a metric fails any of these filters, it weakens the narrative thread. Presenters sometimes include figures because they look impressive or technical, but impressive metrics without context only inflate confusion.
Structuring a Narrative Around Numbers
Audiences do not remember numbers; they remember relationships between them. That is why sequencing matters. A KPI presentation flow should mirror the way reasoning unfolds. Random order forces the audience to do mental work that the presenter should have already done.
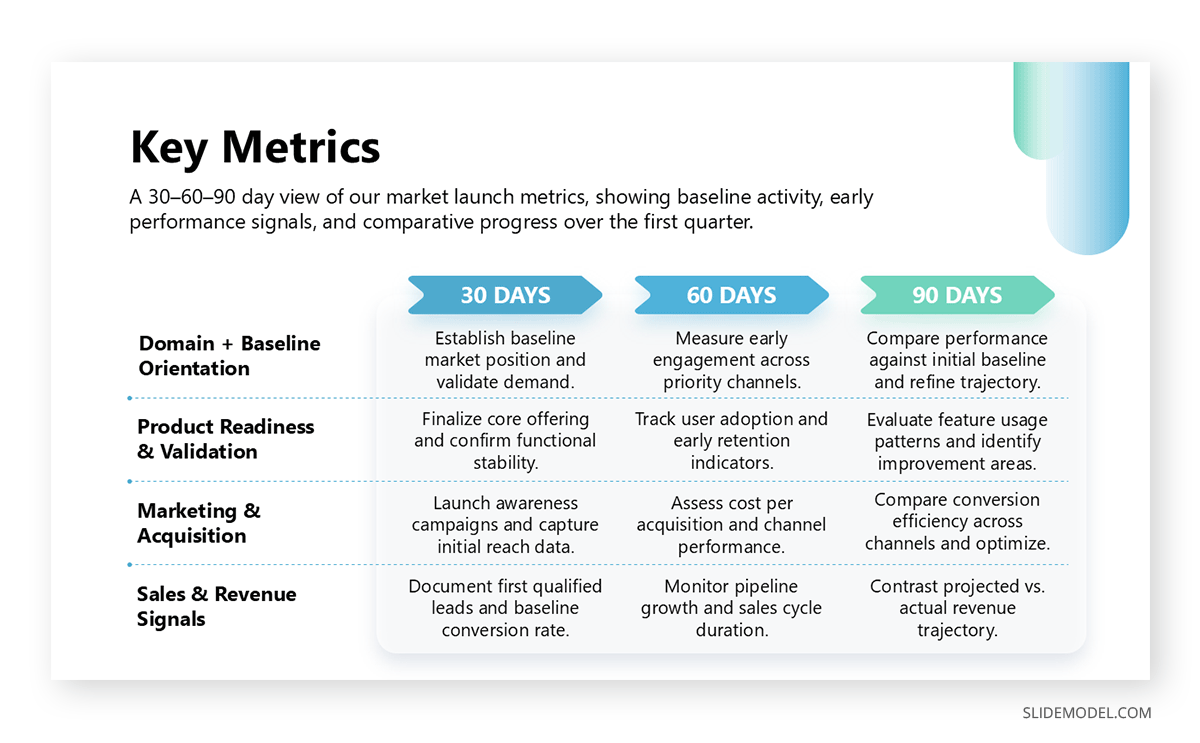
A coherent presentation structure begins with orientation. The audience needs to know what domain the metrics describe before diving into specifics. Introduce the field, timeframe, and baseline first. Only then move into trends, contrasts, and implications. When business metrics appear in a logical cascade, from general to specific, from static to comparative, comprehension increases exponentially.
Storytelling presentation principles apply. Every presentation benefits from tension and resolution. Tension arises from a problem, goal, or question; resolution comes through data that explains how it was addressed. For instance, start by presenting the initial challenge: declining engagement, inefficiency, or limited reach. Then show the metrics that trace the recovery. This cause-and-effect structure gives the data meaning and creates narrative momentum.
Transitions are equally critical. Audiences can absorb a limited number of figures before they need interpretation. Each segment of a presentation should end with a sentence that closes the loop: “This metric shows where we were; the next slide shows what we did about it.” Such cues guide cognition and prevent fatigue.
Finally, avoid presenting every dataset as equally important. Hierarchy clarifies focus. Lead with the most impactful metric, the one that encapsulates the presentation’s central message, and let secondary data reinforce it. When numbers are layered purposefully, they behave like evidence in a logical argument rather than decorations scattered across a screen.
Slide Design for Key Metrics
We can follow the previously mentioned guidelines, but we still don’t have a clear selection of key presentation metrics. Why? Because design matters when presenting metrics, and a number of variables can affect what seems like a good slide, negatively impacting your presentation’s performance:
- Projectors can distort color
- Rooms vary in brightness
- Whether or not you’re using fonts installed on the computer where the slide deck is shown
Therefore, to cover our backs, let’s set a group of rules to ensure proper slide design for presenting metrics. Some of the rules mentioned here can be found in more detail in our articles on the best fonts for PowerPoint, and color theory for presentations.
Rule #1 – Visual Hierarchy
As with any medium of visual communication, the audience should know within two seconds which figure is primary. Use scale, contrast, and spacing to guide the eye naturally. Subtle differences in font weight or background shade can more effectively direct focus than arrows or highlights. Clarity always precedes style.
Rule #2 – Cognitive Load
If every element on a slide competes for attention, all you get is a very confused audience. Instead, avoid the temptation to visualize every data point. If five numbers explain a trend, show three. Summarize the rest verbally or through progressive disclosure, revealing additional data only when context requires it. This method keeps the audience oriented while preserving depth for those who want it.
Also consider the physical environment. A slide that looks balanced on a laptop can appear cluttered on a large screen. Test your design at presentation scale. Simplify labels, increase line thickness in charts, and verify readability from the back of a room. A metrics slide should withstand distance and time without losing coherence.
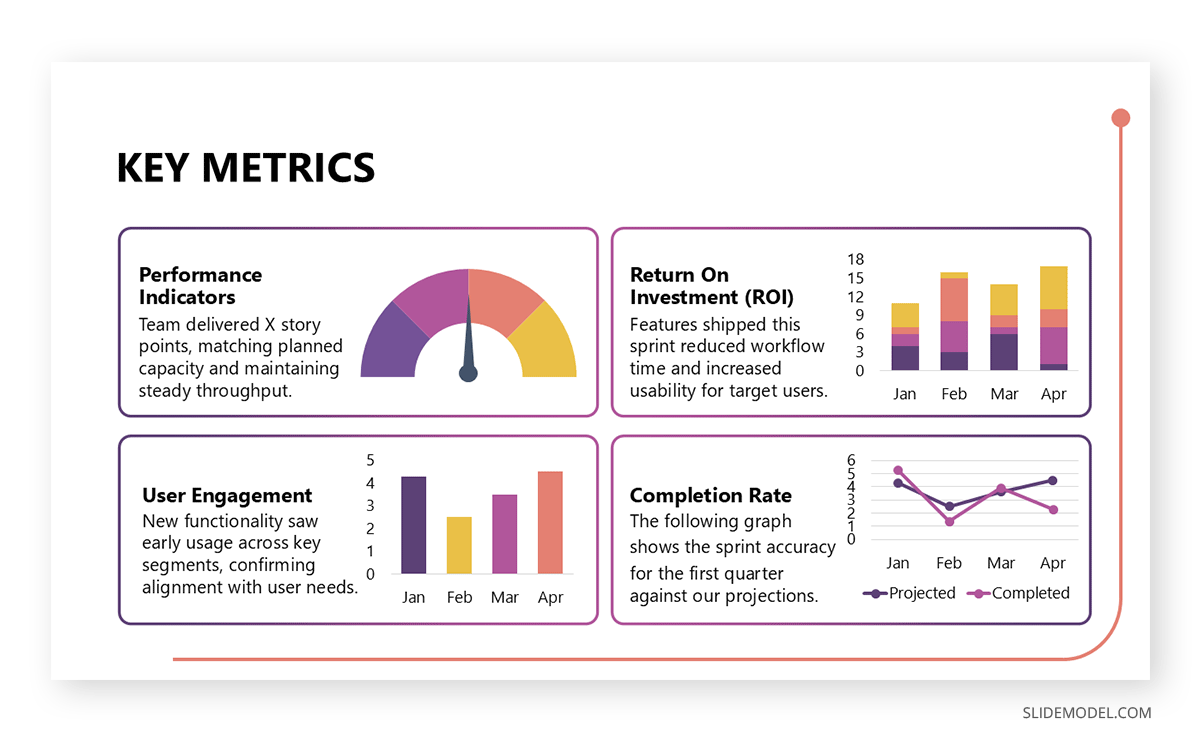
When building a key metrics slide, frameworks such as KPI dashboards, comparison charts, or trend-line templates help presenters maintain structure and clarity.
Rule #3 – Color Choice
Color is not for decoration; there’s a meaning behind it. Consistent use of color categories in metrics presentation templates, such as blue for performance, gray for baseline, and green for growth, helps the audience decode information instinctively. Avoid bright contrasts, such as full white or full white colors, since they fatigue the eye. Be cautious with gradients or textures, as they can obscure precision.
Visual Consistency and Cognitive Clarity
Metrics become harder to trust when visual conventions change mid-presentation. Consistency in style, scale, and notation is a silent guarantee of professionalism. It assures the audience that the same logic governs all data they see.
Start with numeric formatting. Decide whether to display figures with or without decimals, percentage signs, or separators, and apply the same rule throughout. Shifting from “12.5%” to “13%” or mixing symbols (“$1.2M” and “USD 1.2 million”) breaks rhythm and subtly reduces perceived accuracy. Establish a formatting guide before creating slides.
Color systems require equal discipline. Choose a palette that assigns meaning systematically. For instance, one color for goals, another for actual results, and a neutral tone for baselines; this is basic in any PowerPoint metrics slide example. This repetition trains the audience’s perception; they learn to decode more quickly as the slides progress. Random colors may look appealing in isolation, but cause disorientation when seen sequentially. Do keep in mind accessibility for presentations, as color blind people may see labels or numbers as grey when they could be red or green.
Labels and legends should remain minimal and consistently placed. If one KPI slide design places labels above bars, keep that structure across the set. Every change forces the viewer to reorient, consuming mental energy that could be better spent understanding the message.
Scale consistency prevents distortion. When multiple charts use the same units or categories, align their axes. A common mistake is to adjust scales for aesthetic reasons, making differences appear larger or smaller than they are. Audiences rarely check axis values closely; they interpret by shape and proportion. Maintaining uniform scales ensures visual honesty.
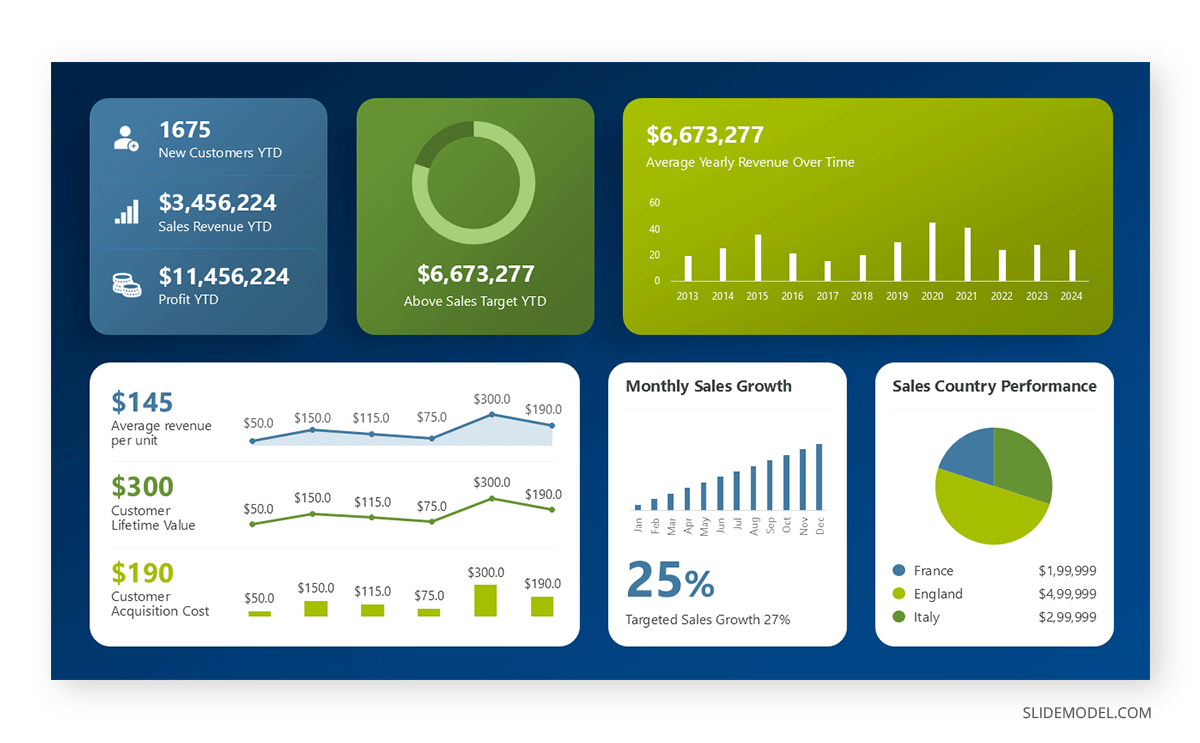
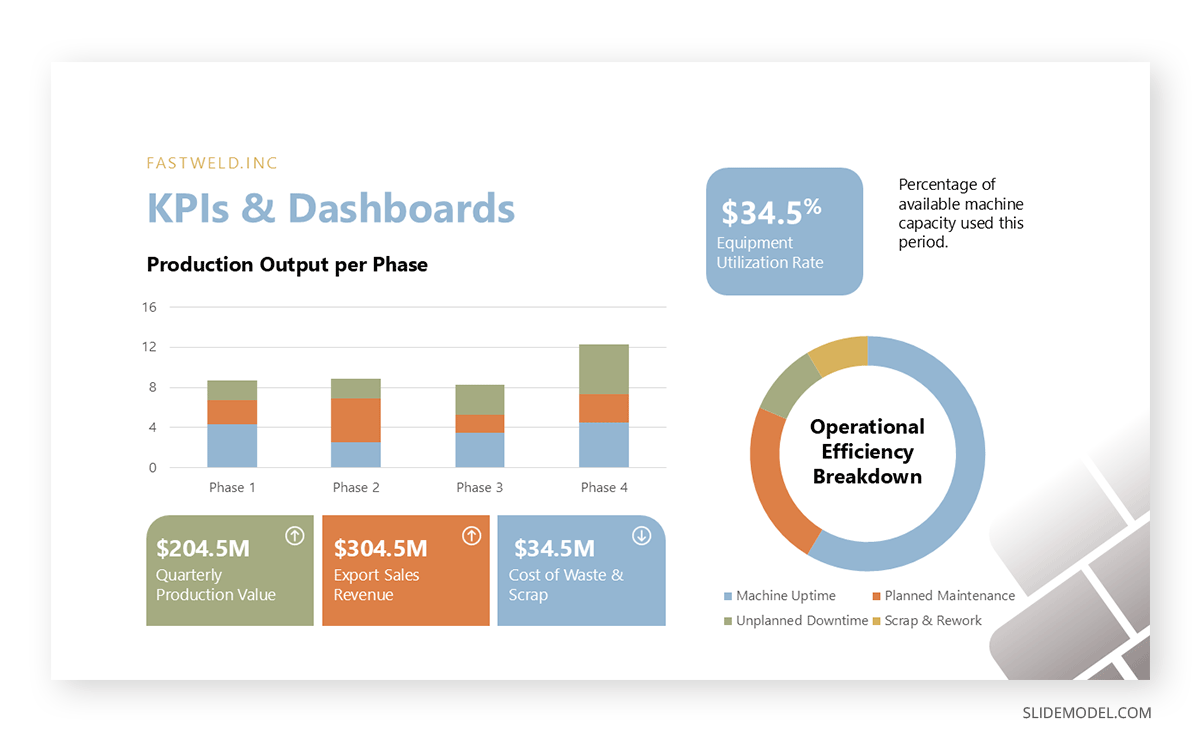
Finally, avoid decorative overload. Effects like drop shadows, 3D shapes, or gradient fills can mislead the perception of area and volume. A flat, clean design preserves cognitive clarity. Opt for PowerPoint metrics dashboard templates whenever in doubt.
Framing Context and Interpretation in a Key Metrics Presentation
Numbers are descriptive, not explanatory. They show what happened, but not why. Without interpretation, metrics risk being misunderstood or dismissed. A presenter’s job is to frame context, to act as the bridge between data and meaning.
Context begins with baselines. A number only matters relative to something else. Saying that productivity increased by 8% is meaningless unless the audience knows from what starting point and over what period. Every key metric should include or imply a reference: previous results, industry standards, or target values. This comparative anchor transforms isolated data into insight.
Next comes interpretation. Explain what the data implies about behavior, process, or strategy. Instead of reciting figures, describe what pattern they reveal. We can take the following metric reporting example: “Notice how the spike in March corresponds to the campaign launch; this confirms the effect we anticipated.” Such phrasing turns metrics into narrative evidence. It also shows analytical ownership; you are not merely reporting but reasoning.
Avoid over-interpreting. Audiences can detect when conclusions stretch beyond the data’s reliability. Acknowledge uncertainty when it exists: “The sample was limited, but initial results suggest a positive correlation.” This transparency doesn’t weaken credibility; it strengthens it by signaling intellectual honesty.
Framing also involves anticipating misinterpretation. If a chart could be read multiple ways, state explicitly what it means in your context. This is why data storytelling for metrics is critical, especially in financial metrics presentations.
Delivering Metrics with Confidence
Even flawless slides fail if the delivery feels hesitant. Presenting metrics demands composure because numbers amplify credibility or expose uncertainty instantly. A shaky tone while quoting a figure undermines trust more than any design flaw, so it’s time to work on your public speaking techniques.
How can we break that presentation anxiety cycle? Presenters should internalize their metrics rather than read them. Knowing the source, calculation method, and implications of each number enables spontaneous explanation if questioned. Rehearse aloud, not silently, to adjust pacing and rhythm. Data presentation is as much about performance as it is about logic.
Voice control is crucial. Numbers should be spoken clearly, with deliberate pauses after key points to let the audience process. Avoid rushing through values; silence is part of emphasis. A short pause after an important statistic signals weight and helps the listener connect it to meaning. Overloading speech with numbers back-to-back blurs comprehension.
Gestures can reinforce interpretation. Pointing to a specific part of a chart while naming it grounds abstract information in space. This synchrony between gesture and speech enhances retention. However, gestures should never substitute for verbal explanation. They guide attention but don’t create understanding on their own.
A confident presenter also manages transitions gracefully. When moving from one metric to another, bridge the two with reasoning. For instance, “Now that we’ve seen how efficiency changed, let’s examine how that affected costs.” These connectors sustain coherence and show mastery of content flow.
Finally, focus on your body language. The audience can tell how confident you feel in the metrics you’re aiming to explain by looking at your posture or small gestures.
Adapting Key Metrics for Different Audiences
Metrics never exist in isolation; they exist for someone. Understanding who that someone is determines what form they should take. A technical audience values precision and methodological transparency, while a managerial audience seeks implications and decisions. The same dataset can yield both, but it must be reframed.
Start by analyzing the audience’s relationship to the topic. Are they stakeholders responsible for outcomes, observers seeking understanding, or decision-makers judging performance? Tailor the metrics accordingly. Stakeholders need detailed granularity to validate effort. Data-driven decision-making requires synthesis to make choices. Observers require clarity to grasp scale and relevance. A good presenter builds three versions of the same message and deploys the one suited to the context.
Metrics for board presentations imply reducing complexity. Highlight the metrics that represent strategic outcomes, revenue growth, efficiency ratios, or performance improvements, and focus the discussion on implications. Supporting data can appear in an appendix or backup slide. The aim is to make comprehension instant, not exhaustive.
For technical teams, precision matters more than simplicity. Include confidence intervals, methodologies, and units of measurement. Ambiguity erodes trust among experts, so transparency outweighs elegance. Maintain order through clear formatting rather than omission.
When looking at how to explain metrics to non-technical audiences, storytelling techniques help bridge the gap between abstraction. Replace specialized vocabulary with accessible analogies: “This improvement means we saved the equivalent of two working days per week.” Such translation makes metrics tangible.
Cultural context also matters. Visual preferences and interpretation styles differ across regions and industries. A color indicating success in one culture may imply caution in another. When presenting internationally, research visual conventions to avoid misinterpretation.
Common Mistakes in Presenting Metrics
Misleading or Unverified Data
Using outdated or incomplete figures permanently damages credibility. Always verify sources and double-check calculations. If time constraints force reliance on estimates, mark them clearly. Transparency preserves trust even when precision isn’t possible.
Overcomplication
A slide dense with metrics appears comprehensive but overwhelms perception. Complexity should exist in preparation, not in display. Reduce cognitive strain by grouping related data and introducing them progressively. The audience should never have to read small text or decipher intricate tables.
Lack of Context
Metrics lose value when detached from their environment. Presenters sometimes list numbers without indicating period, scope, or benchmark. Always answer the implicit question: Compared to what?
Poor Visual Hierarchy
If every number is highlighted equally, none stands out. Use scale and contrast to guide attention. A deliberate structure shows intentionality and makes the message memorable.
Inconsistent Timeframes or Units
Switching between monthly and quarterly data or using mixed units confuses interpretation. Consistency signals rigor. If different measures must coexist, clarify transitions verbally to avoid misreading.
Overconfidence in Visuals
Design cannot compensate for a lack of interpretation. Charts for presenting metrics serve to illustrate, not replace reasoning. Never assume a visual “speaks for itself.” It rarely does.
FAQs
What qualifies as a “key” metric?
A key metric directly measures the performance or outcome that defines success in your context. It isn’t necessarily the most significant or most impressive number, but the one that best reflects progress toward your goal. The term “key” implies selectivity; the metric without which your audience cannot fully understand your message.
How many metrics should a presenter include per slide?
Ideally between three and five. Fewer may feel incomplete; more creates cognitive overload. If additional figures are essential, distribute them across multiple slides or use supporting visuals that reveal details progressively.
What is the best way to choose which metrics to highlight first?
Start with the one that encapsulates your central message: the metric that would summarize the story if you had only ten seconds to speak. Place it visually at the top or center, using supporting data to explain its evolution or consequences.
Should metrics always be shown numerically, or can qualitative scales work too?
Both are valid. When numerical precision adds clarity, use numbers. When measuring perception, satisfaction, or quality, a visual scale or index may convey meaning more efficiently. The choice depends on what makes the relationship between effort and outcome easiest to grasp.
What chart type is best for presenting key metrics?
No single type fits all. Line charts are ideal for trends, bar charts for comparisons, pie or donut charts for composition, and tables for precise figures. The proper format is the one that answers the audience’s question as quickly as possible, without distractions.
How to simplify complex metrics in slides?
Focus on one idea per slide. Start with the core takeaway, then move supporting details to later slides or verbal explanation. Use clean visuals instead of dense tables, remove unnecessary decimals or labels, and group related data so the audience sees patterns instead of noise. Maintain consistent units and colors, and convert abstract numbers into relatable comparisons when possible. The goal is clarity, not compression.
How do I provide context for metrics without overloading slides?
Use short comparative statements: “Up 12% from last quarter” or “Two times higher than industry average.” These cues frame interpretation instantly. Reserve detailed methodology or references for appendices or verbal explanation.
What should I do if some metrics show poor performance?
Address them directly. Hiding weak results invites skepticism. Present the cause, corrective action, and next step. Transparency conveys control and analytical maturity, while avoidance suggests uncertainty.
Should I animate metric slides?
Only if it enhances pacing or narrative flow. Simple sequential reveals can guide attention, but complex transitions distract. If a slide depends on animation to make sense, redesign it. A good metric slide must still work as a static image.
How can I speak confidently about metrics if I’m not good with numbers?
Learn their meaning, not their formula. You don’t need to memorize every decimal, but you must understand what each figure represents, how it was derived, and why it matters. Confidence grows from comprehension, not memorization.
Which storytelling techniques for metrics presentation can help my performance?
Introduce the metric through its context first, then reveal the number as the resolution. Show cause and effect by pairing each figure with the action that influenced it. Use before-and-after contrasts to create a clear narrative path, and place the most important metric at the climax of the sequence. Guide transitions with short framing lines that explain why the next data point matters. This turns each metric into a step in a larger story rather than an isolated figure.
Should I include targets or benchmarks alongside results?
Yes. Results gain meaning only when compared against a goal. Display both achievement and target values to transparently frame progress. This not only communicates outcomes but also demonstrates accountability.
Final Words
At their best, metrics are the intersection between analysis and storytelling. They quantify what words cannot, yet rely on language to acquire meaning. When handled skillfully, they go beyond the application of business performance templates; they reveal the thought process behind decisions. They show how an individual or team interprets the world through structure, logic, and evidence.
Presenters who master key metrics understand that their goal isn’t persuasion by magnitude but persuasion by clarity. Big numbers may impress momentarily, but coherent explanations endure. The audience remembers how the presenter made complexity feel manageable. That sense of order is what generates trust.