RAG Dashboard Roadmap Template
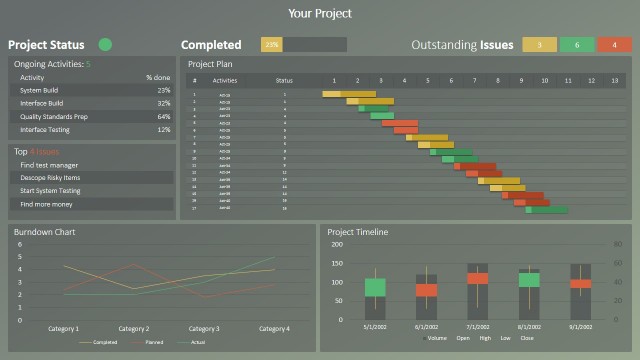
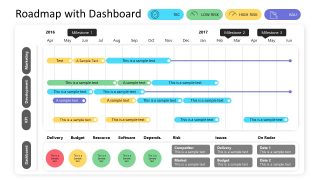
The RAG Dashboard Roadmap Template is an organized dashboard diagram designed to trace the progress of a project or plan. A RAG dashboard is a tool to show the status of various tasks using three colors, i.e., Red, Amber(Yellow), and Green. The red color represents a task requiring immediate attention, the yellow depicts a warning, and the green color shows an all-good status. A roadmap presentation is an ideal option for project managers, planners, and other professionals to trace the activities of a process.
The RAG Dashboard Roadmap Template is divided into two sections. The upper section of the slide shows a Gantt chart, which traces the High Risk, Low Risk, Business As Usual (BAU), and To Be Confirmed (TBC) activities along the mentioned time. These parameters, represented with different colors, are studied for factors shown on the Y-axis, i.e., Marketing, Development, and KPI (Key Performance Indicator). The graph shows the time scale on the X-axis. The graph’s legend showing the distinct colors of the four parameters is shown on the top-right corner of the slide. In between the axes, color-coded lines and oval shapes of the mentioned parameters represent a specific activity at a particular time point, e.g., Low-Risk activity or High-Risk activity.
Users can change the representative colors, names of the tiles, factors, or the placement of the shapes within the graphical matrix. A RAG dashboard on the bottom of the slide is shown using differently colored circular shapes containing text areas. Users can represent a track of Delivery, Budget, or Resources activities. Also, four rectangular text boxes are on the right-bottom corner to mention some risks or issues, etc.
Project managers and business professionals can use this roadmap template for interactive representations of various tasks and activities throughout the year. This Gantt chart template is 100% editable. Users can easily replace the placeholders and edit the placement of shapes on PowerPoint or Google Slides.

You must be logged in to download this file.
DOWNLOAD- Category
- Timelines & Planning
- Rating


 Loading...
- Size
- 16x9
- Item ID
- 52016-02
- Colors
Subscribe today and get immediate
access to download our PowerPoint templates.