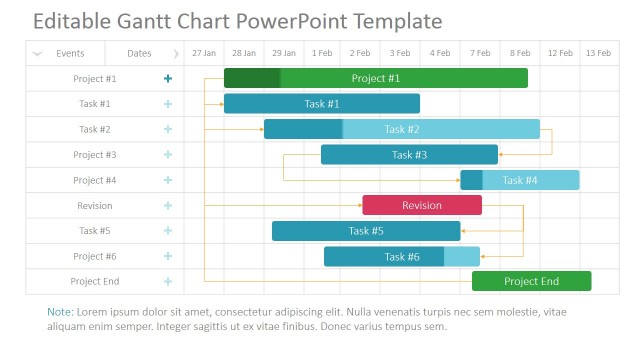
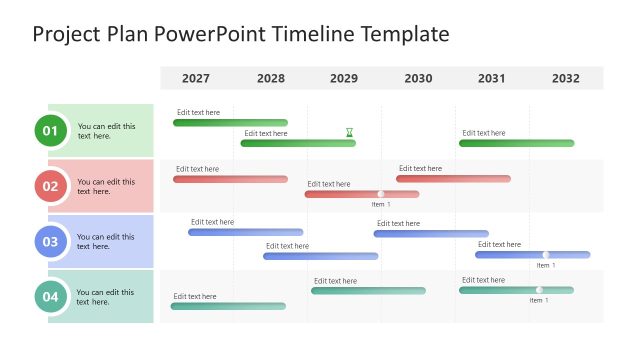
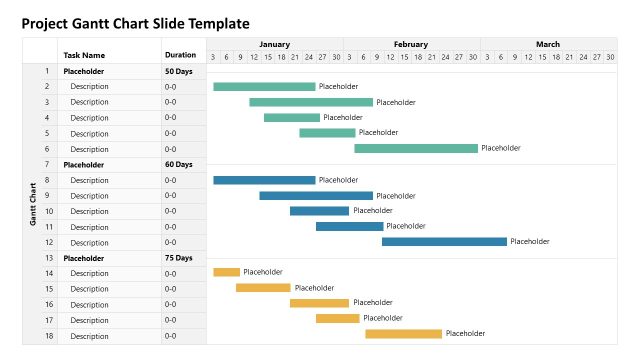
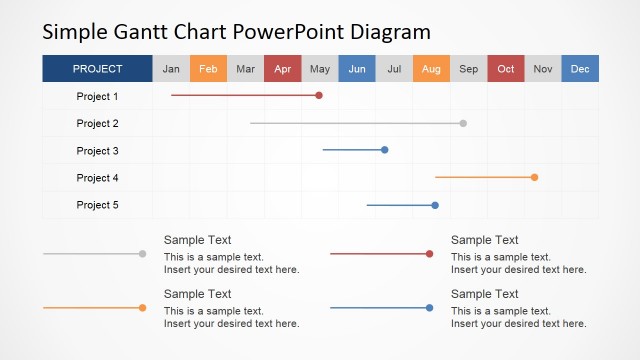
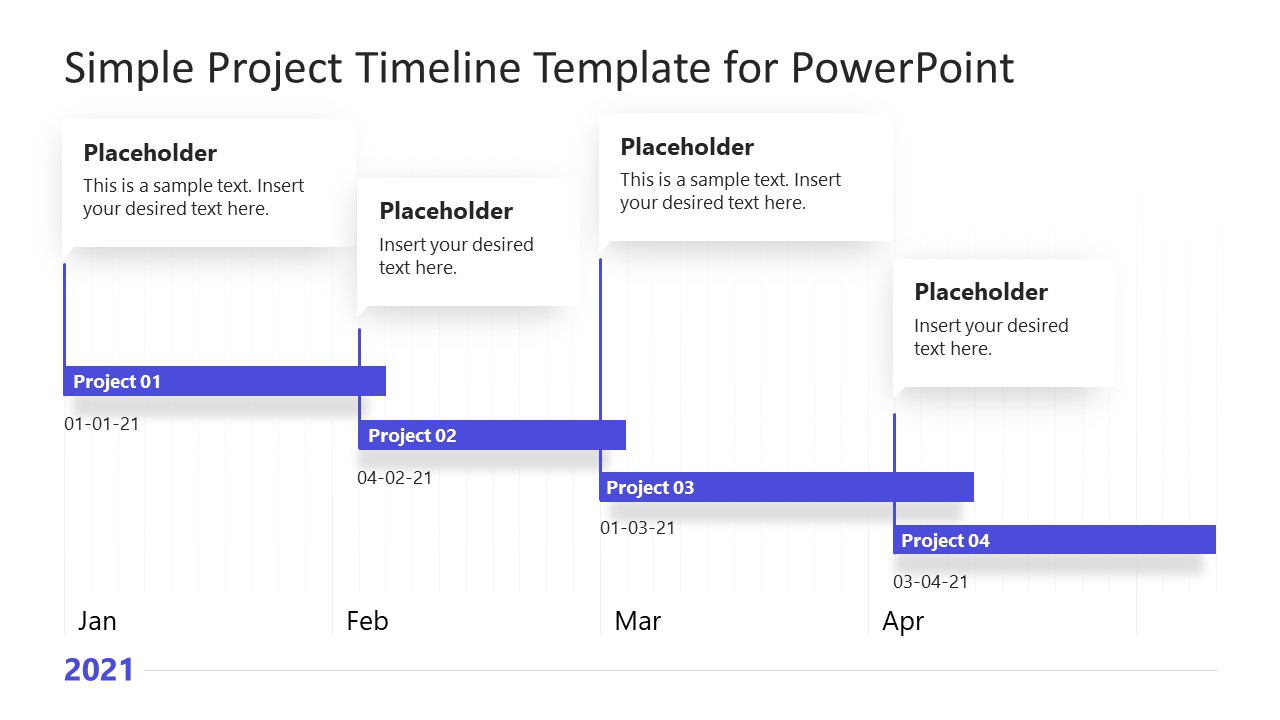
A Simple Project Timeline Template for PowerPoint is a management presentation layout. It displays the status of four projects on one slide Gantt chart template. This gantt chart template gives an excellent start to presenting the project schedule in one place. Gantt chart is a visual presentation tool to demonstrate tasks and milestones of the project at a glance. The project timeline template gives a high-level overview of when deliverables are due. The timeline PowerPoint template of four projects highlights each project’s estimated start and end date. An overlap of dates indicates the allocation of time and resources on more than one project at a time. Alternatively, project managers can download other project timeline slides with 100% editable milestones and elements.
Gantt charts visually represent projects that use horizontal bar charts to display tasks and deliverables. The project management team uses the Gantt chart view for the project timeline to represent high-level initiatives over time. The presentation of the project roadmap in Gantt chart format provides an overview of three key components. These are project deliverables, key milestones, and overall project goals. A simple Project Timeline Template for PowerPoint displays these three components for four projects under management. This timeline PowerPoint contains blue bars for projects over four months. The timeline template offers two background color options. Users can choose the desired color or customize slides according to the PowerPoint theme of the project presentation.
A simple design of a project timeline provides labels over the starting point of each project. Here, you can briefly describe the project’s scope, deliverables, and estimates for stakeholder meetings. Alternatively, the project roadmap template can be used for milestones of one project on different timeline scales.
What’s inside this template
Example presentation scenarios
- A project manager can use the Gantt chart slide to brief executives on four parallel projects and show where schedules overlap across January, February, March, and April.
- A PMO lead can use the monthly timeline and horizontal project bars to compare portfolio timing before a resource planning meeting.
- An operations manager can use the callout notes above each project bar to explain deliverables, assumptions, or milestone risks during a production schedule review.
- A consultant can use the dark-background version to present a concise roadmap update in a client meeting where timing and dependencies are the main decision points.
Features
- 100% editable presentation template
- Compatible with Microsoft PowerPoint and Google Slides
- 16:9 aspect ratio slides
- Scalable vector shapes, icons and illustrations
- AI-Ready for Microsoft Copilot and Claude
- Instant access and download
Frequently asked questions
Q: How should a presenter explain the timeline without overcrowding the slide?
A: Lead with the time span first, then walk left to right through each project bar. Use the callout boxes for one message per project, such as scope, milestone, or risk. Keep detailed task lists out of this slide so the audience focuses on duration, start points, and schedule overlap.
Q: Who is this template best suited for?
A: This template is best for project managers, PMO leads, consultants, and operations teams who need a brief schedule snapshot rather than a full project plan. The four horizontal bars make it useful for portfolio updates, production planning, or client check-ins where timing is more important than task-level detail.
Q: Why does the Gantt layout improve the schedule discussion?
A: The horizontal bars turn dates into a visual comparison, so overlaps and gaps are easier to see than in a written status list. The month scale creates a shared reference point, while the callout boxes separate explanation from timing. That structure helps stakeholders discuss priorities without losing the calendar context.


Simple Project Timeline Template for PowerPoint
2-slide presentation template with Gantt chart project timeline layouts for schedules and roadmap updates
Simple Project Timeline Template for PowerPoint is a 2-slide project schedule template for Microsoft PowerPoint and Google Slides. It shows a Gantt chart, monthly project timeline, horizontal task bars, and milestone callout notes for project managers who need to present overlapping work across several projects.
- Category
- Timelines & Planning
- Rating


 Loading...
- Aspect ratio
- 16:9
- Item ID
- 21227-01
- Colors
 Microsoft PowerPoint
 Microsoft Copilot
 Claude for PowerPoint
Other formats supported
Subscribe today and get immediate
access to download our PowerPoint templates.