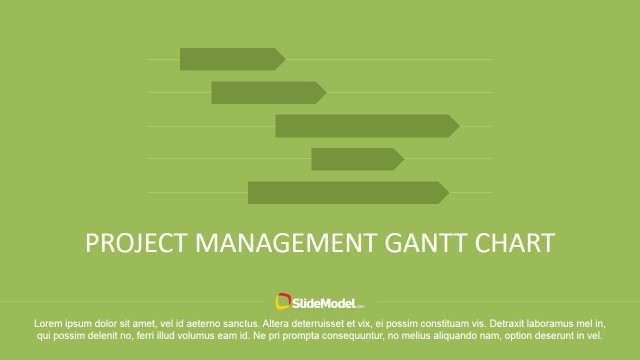
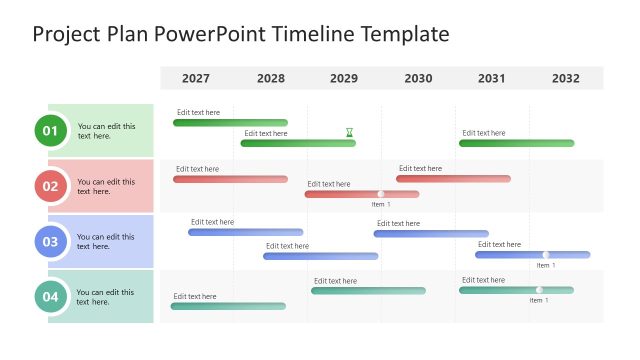
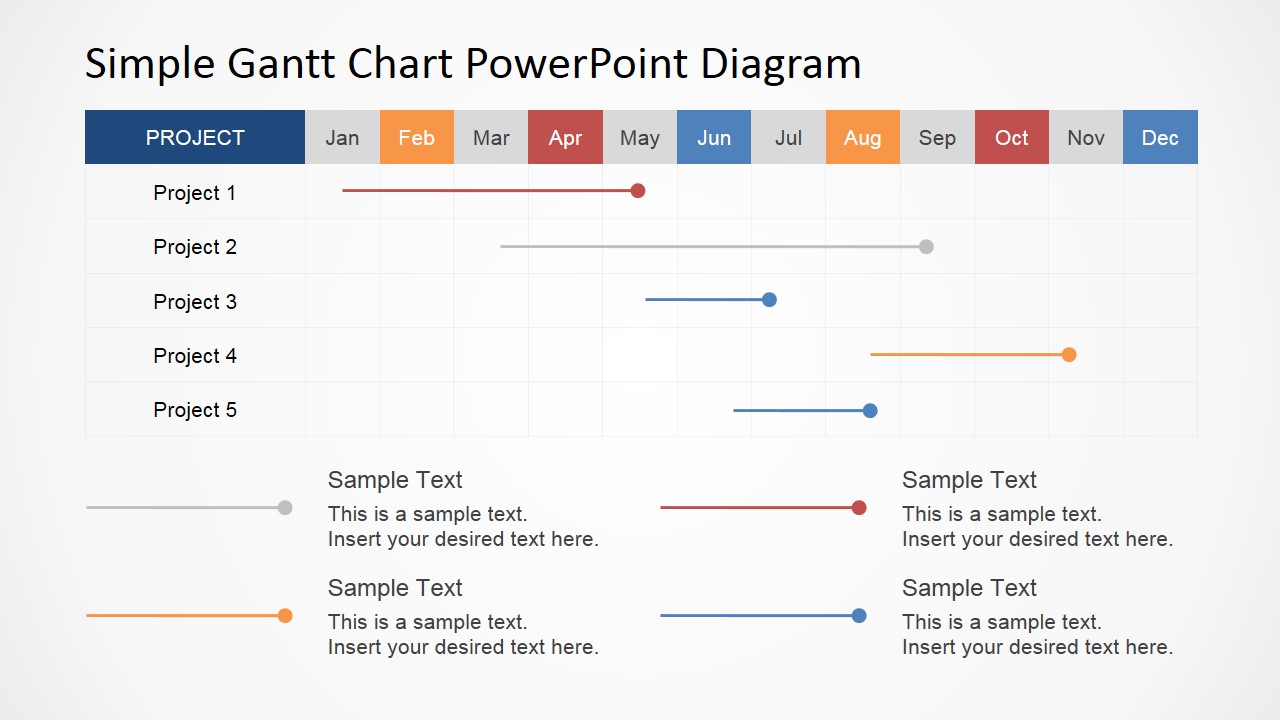
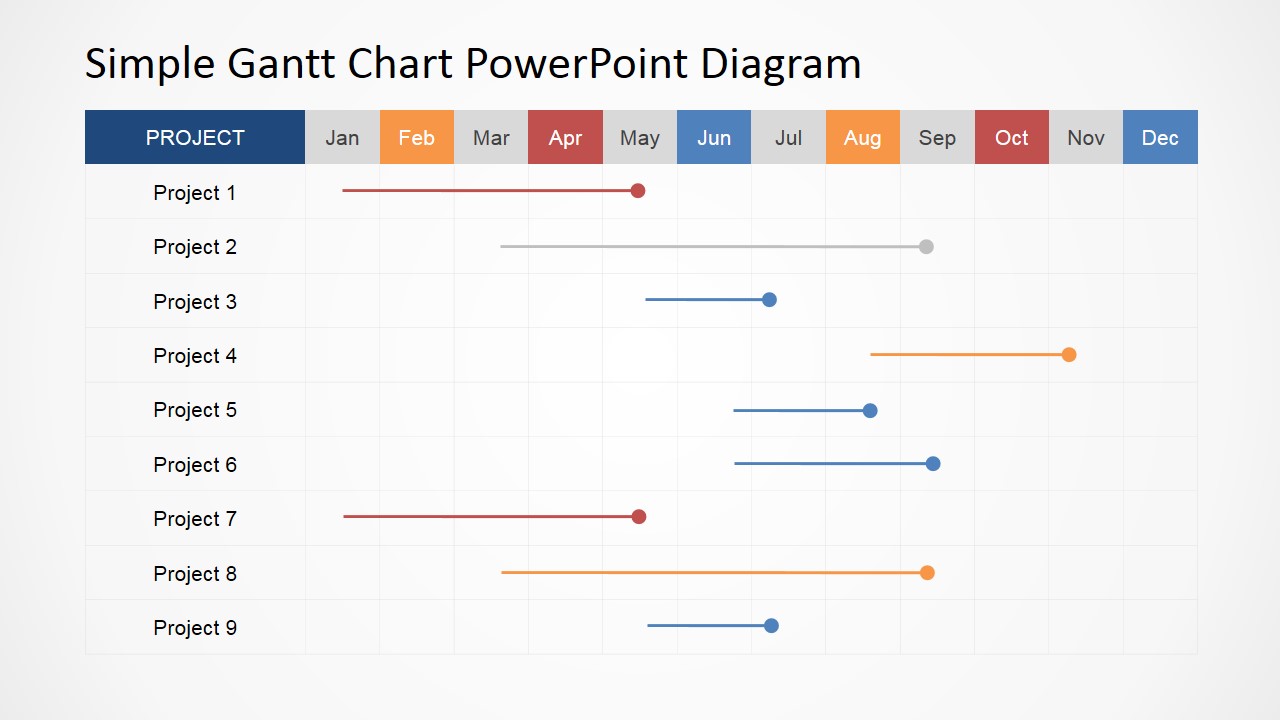
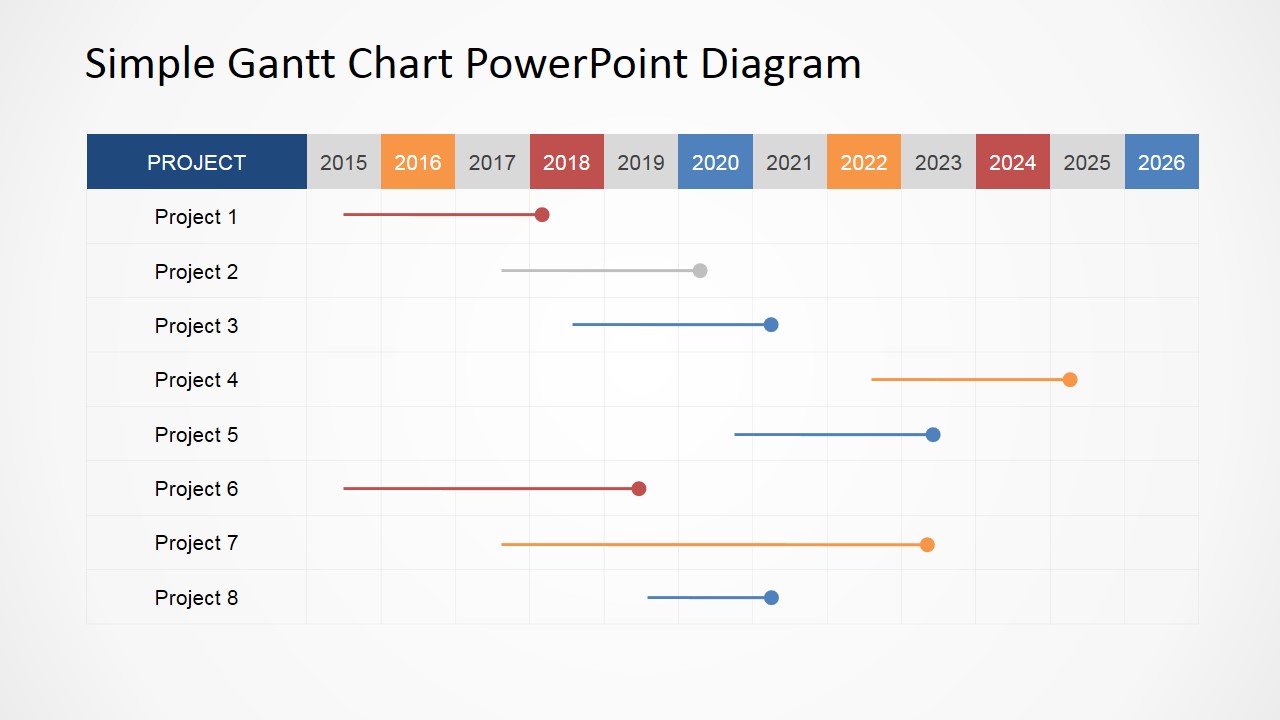
Simple Gantt Chart PowerPoint Diagram
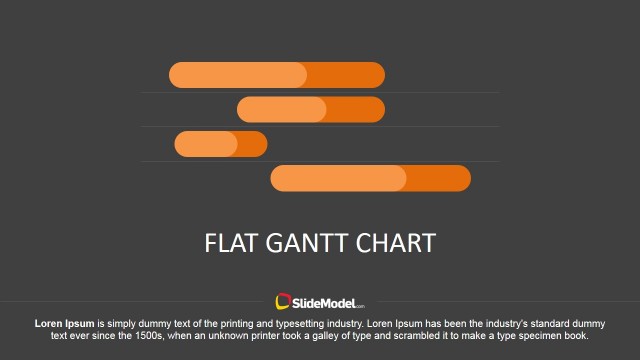
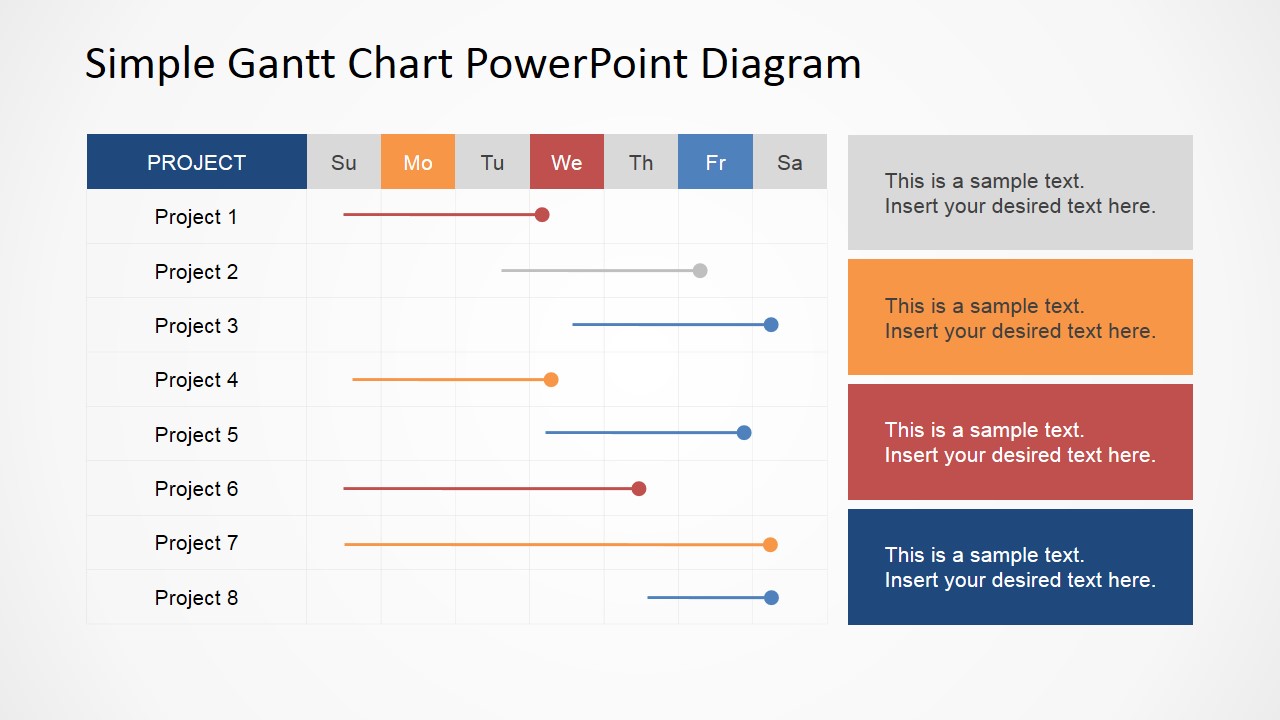
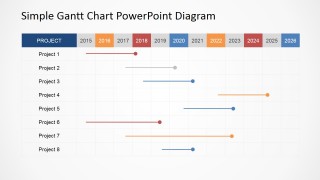
Simple Gantt Chart PowerPoint Diagram – Make a highly professional report for a project management with an easy-to-use Simple Gantt Chart PowerPoint Diagram. This PowerPoint design provides effortless yet clear and concise professional details for a business project or activity. Most Gantt charts templates are made in Excel however, by virtue of this design you can now present it in PowerPoint. This presentation design is very flexible and allows the chart to be edited for daily, weekly, monthly and annual projects.
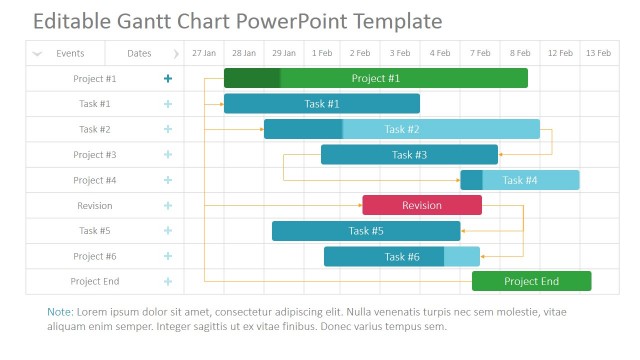
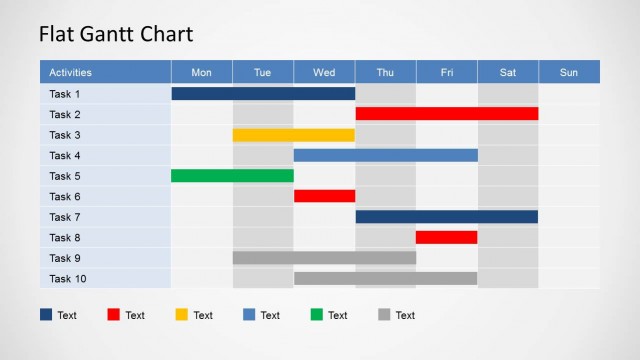
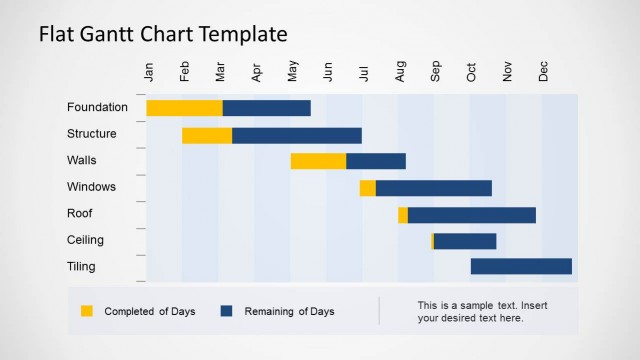
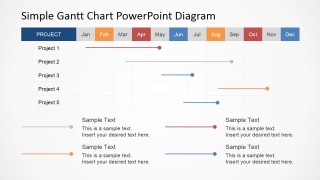
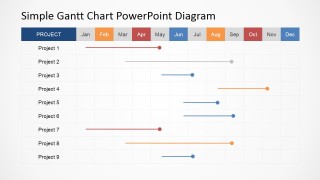
A Gantt chart is a diagram that shows activities and either its allotted timeframe or consumed time or both. It was invented by a Polish engineer named Karol Adamiecki and later developed by Henry Gantt, hence the term Gantt chart. In its simplest form, it lists down in a column the activities involve and plots the timeframe in header. Usually, the timeframes for it is daily, weekly or monthly. The time associated for each activity is indicated by highlighting its timeframe range. For example, highlighting January to February for Project 1 indicates that this project spent two months until completion. Of course, this project management template is completely editable so you can customize it to suit your reporting plan.
A Gantt chart is an ideal tool for project management tasks such as plotting time allocation for activities, monitoring actual time spent and making comparisons between the two. The details in a completed Gantt chart are very significant source of data in analyzing the development, success or failure of a project. And since it is easy to understand and monitor, all members involved in the project can participate in the development of the chart. The member or group who is responsible in certain task or tasks can mark the time they spent in the task assigned to them. Therefore, the Gantt chart also promotes relevant traits in a team such as active participation, self-supervision, honesty and accountability.

You must be logged in to download this file.
DOWNLOAD- Category
- Timelines & Planning
- Rating


 Loading...
- Size
- 16x94x3
- Item ID
- 6555-03
- Colors
Subscribe today and get immediate
access to download our PowerPoint templates.