A Gantt chart is a horizontal bar chart frequently used in project management. It provides a graphical illustration of a schedule that helps to plan, coordinate, and track specific tasks and activities in a project.
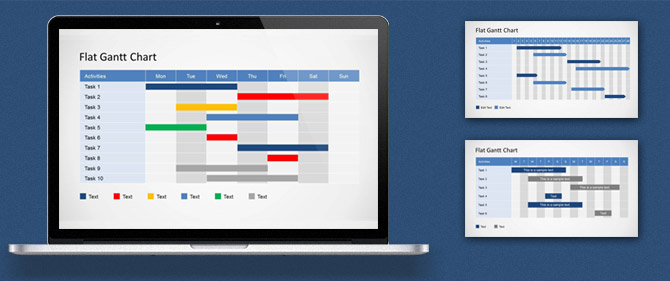
Our editable Gantt Chart PowerPoint templates let you make project planning presentations, task management or project management PowerPoint presentations by using pre-designed graphics and slides.
We have plenty of Gantt Chart templates for PowerPoint designs available at SlideModel that you can download if you are an active subscriber (see plans & pricing).
The Gantt chart examples we have provided may not be ready for your specific needs, and you may be interested in editing them to fit your presentation needs. Here, we will show you how easily you can customize the Gantt Chart activities by taking advantage of our editable templates for PowerPoint & Google Slides.
How to Adjust the Gantt Chart Activity Size
As soon as you open the Gantt Chart PowerPoint template you can select any activity shape and adjust the shape size. First, select the shape you want to edit. If it is part of any grouped shape, please kindly Ungroup it first so you can isolate the graphics and then select the individual shapes.
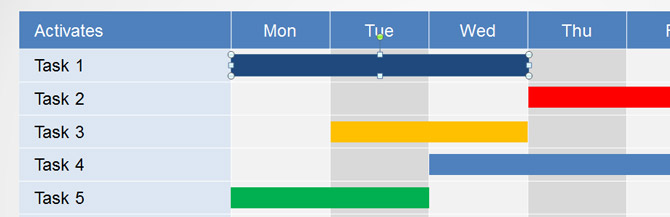
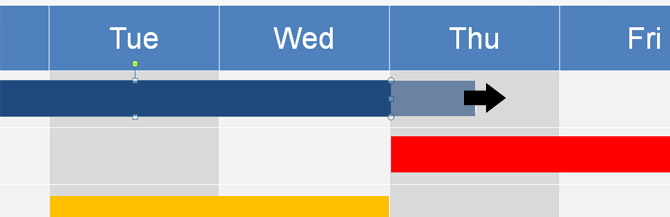
Having the activity shape selected, you can resize the rectangular shape by dragging the square like shown in the picture below. This let you adjust the activity size to any desired width. For example, if an activity is scheduled to run from Monday to Thursday then you can drag the right side of the shape until overlapping the Thursday cell.
How to Edit Gantt Chart Task Name
There are text placeholders available that you can easily edit in PowerPoint. Virtually any text appearing in our PowerPoint templates can be edited by placing the cursor over the text and typing your own titles and labels. In order to edit the Gantt Chart activities text click over the shape and place the cursor over the editable text.
Most of our Gantt Chart templates are created following this approach so as soon as you become familiar editing the first template all future customizations can be achieved easier. You are welcome to check more creative Gantt Chart ideas for project planning presentations here.
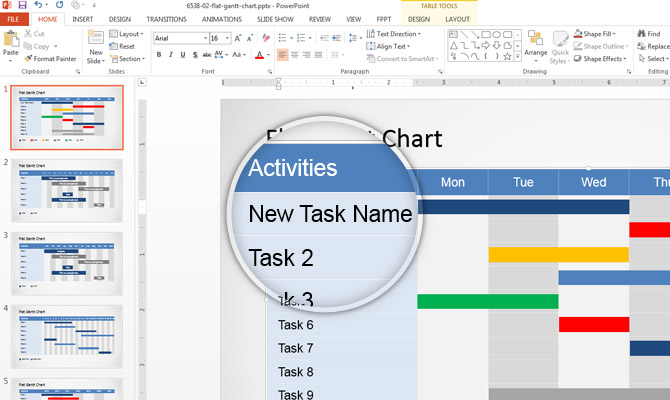
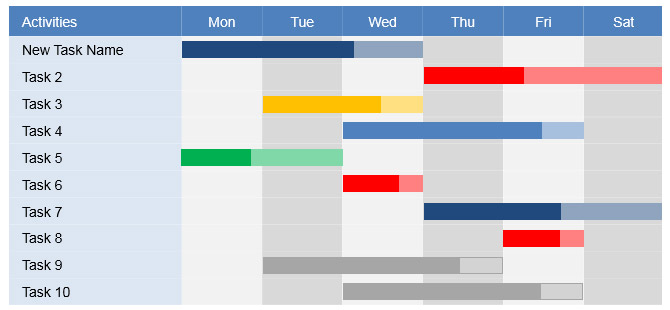
You can also rename the task & activity names in the first column or any other text appearing in the PowerPoint template. The following screenshot shows the first column in a Gantt Chart with a list of activities. We have renamed the first activity to New Task Name in order to show this capability.
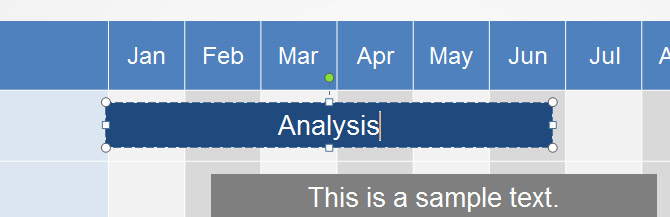
Editing the Gantt Chart header let you modify the version of a Gantt Chart to be used. For example, if you need a monthly version of a Gantt Chart you can edit the header cells and include months from January to December. Similarly if you need to make a Quarterly version of a Gantt Chart for business presentations.
This Gantt Chart template demo contains a simplified version of a Gantt Chart providing a way to display activities scheduled along the time. Creating a Gantt Chart in PowerPoint from scratch is also possible. In order to create a Gantt Chart from scratch you can insert a table in PowerPoint 2013 and then insert rectangular shapes on top to represent each activity. The top header and left column can be used to specify the activities and task names.
Showing the Amount of Work Done in a Gantt Chart
Using Gantt Charts you can show the amount of work done in certain periods of time. If you need to show the amount of work done or percentage of production completed then you can also do it in our PowerPoint templates by editing the shapes.
A Gantt Chart is a chart in which a series of horizontal lines shows the amount of work done or production completed in certain periods of time in relation to the amount planned for those periods.
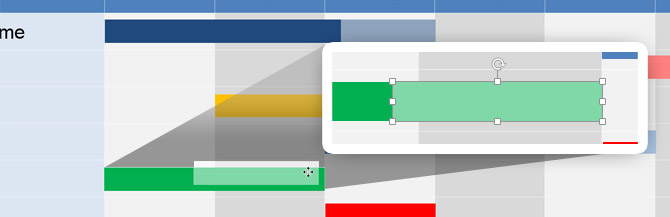
Duplicate the activity shape and adjust the size accordingly to the remaining amount of time to complete an activity.
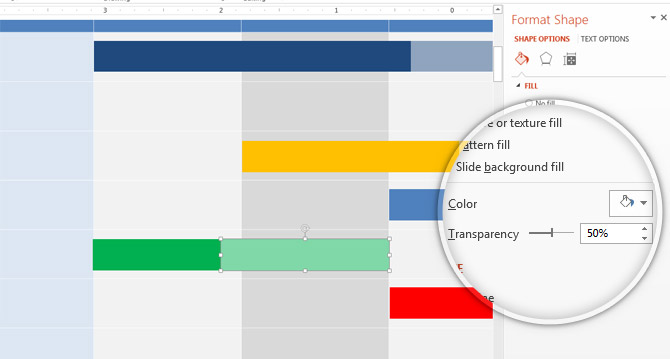
Then, right click over the new shape to Format Shape properties. Choose a new fill color (i.e.: white) and adjust the transparency level to 50%.
Now, duplicate the remaining activity shapes as many times as there are activities you want to show the amount of work done and move the shapes to the desired location.
If you are looking to make presentations containing slides with a schedule or project plan then Gantt Chart slide designs for PowerPoint can be helpful. You are welcome to browse our Gantt Chart PowerPoint templates with creative slide designs or alternatively you can browse the timelines template gallery.