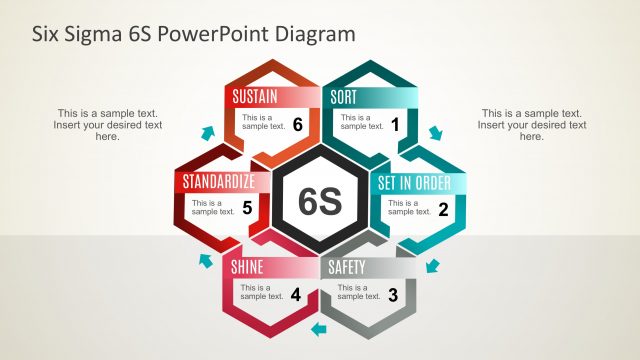
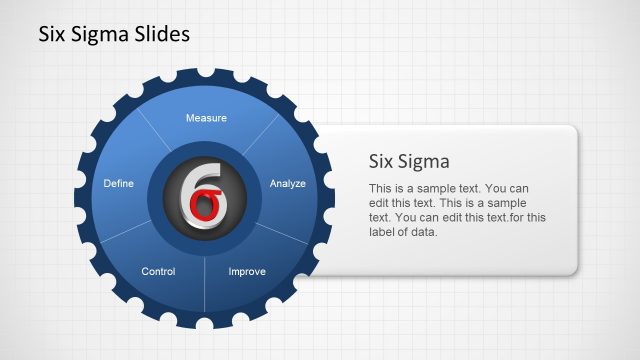
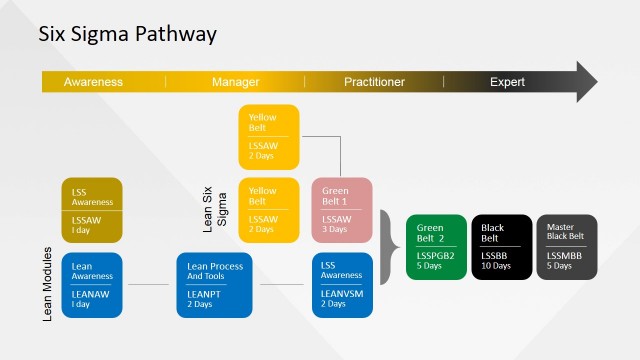
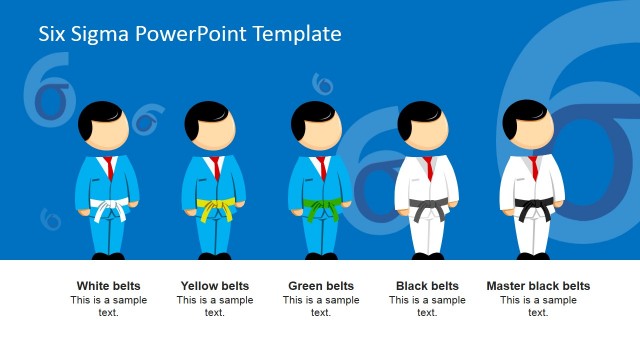
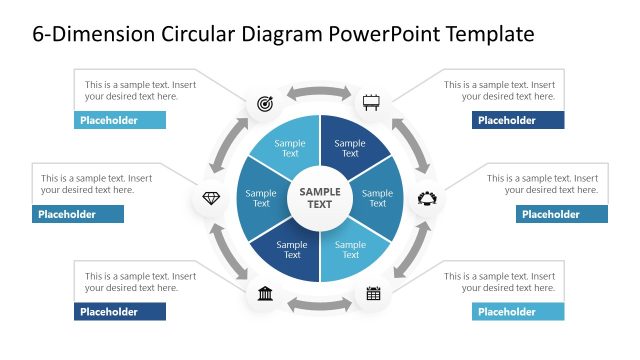
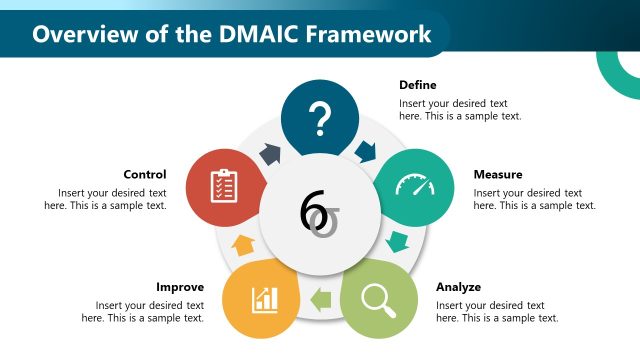
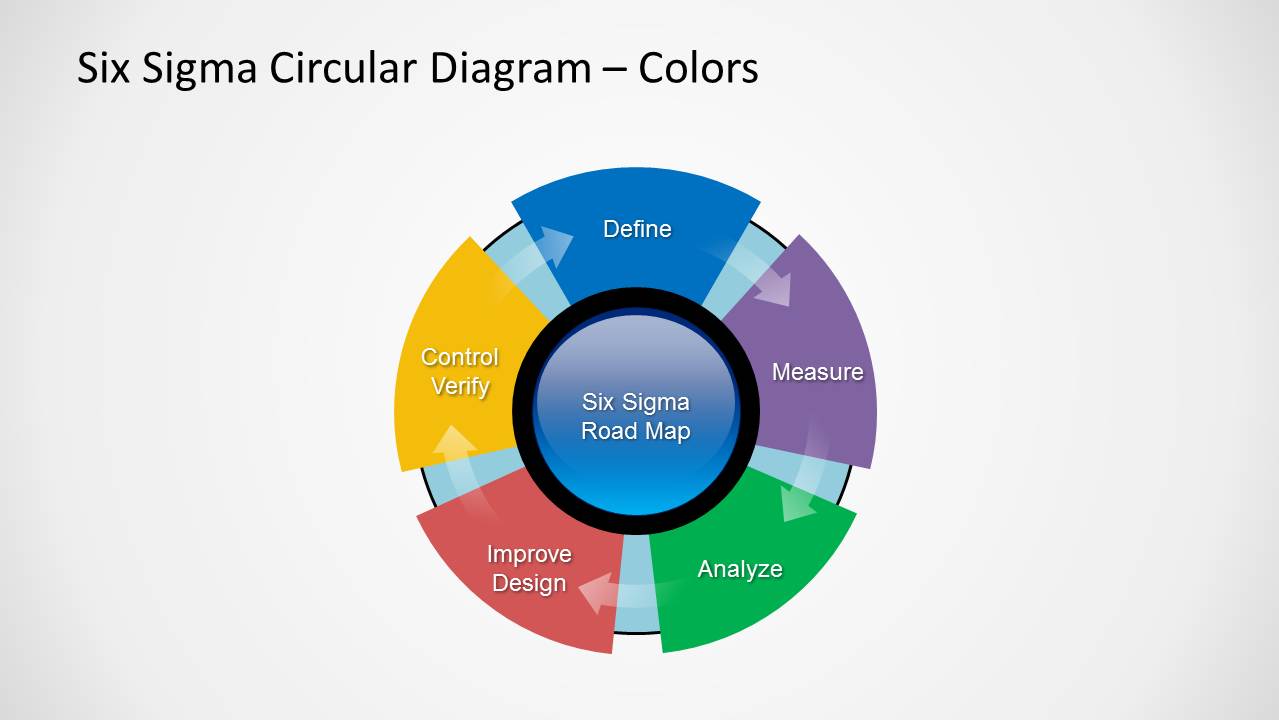
Six Sigma Diagram for PowerPoint is a simple cycle diagram describing the Six Sigma process.
With this template you can create presentations related to the Six Sigma methodology using colorful slide designs which are easy to customize and edit.
With the help of this diagram template you can display different parts of a process, identify problems and propose solutions for improving it, using easy to grasp, attractive PowerPoint Diagrams.
What’s inside this template
Example presentation scenarios
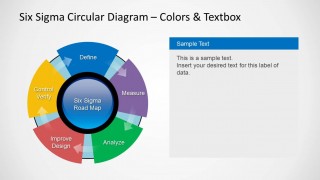
- A quality manager can use the multicolor circular road map to introduce the Six Sigma improvement cycle during an internal process review.
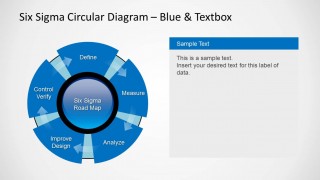
- A Six Sigma trainer can use the blue segmented donut layout to explain each step of the road map in a classroom or workshop setting.
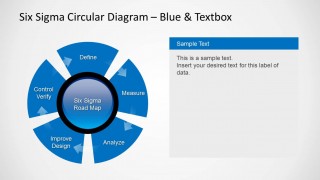
- An operations leader can use the exploded cycle variant to separate process phases visually when discussing handoffs, ownership, or improvement gaps.
- A consultant can use the text-box slides to pair the circular diagram with observations, recommendations, or a short improvement action plan.
Features
- 100% editable presentation template
- Compatible with Microsoft PowerPoint and Google Slides
- Scalable vector shapes, icons and illustrations
- AI-Ready for Microsoft Copilot and Claude
- Instant access and download
Frequently asked questions
Q: How should a presenter walk through the Six Sigma cycle using this template?
A: Start with the center label to define the road map, then move clockwise through Define, Measure, Analyze, Improve Design, and Control Verify. Use the full circular diagram for the overview, then switch to a text-box version when a step needs context, examples, or ownership. Keep the explanation tied to one process improvement initiative.
Q: Who is this diagram best suited for?
A: This template fits quality managers, operations leads, Six Sigma practitioners, and consultants who need to explain a repeatable improvement method without building a full methodology deck. It works best in process reviews, improvement kickoff meetings, and short training sessions where the audience needs to understand the cycle structure quickly.
Q: Why does the circular diagram work for Six Sigma communication?
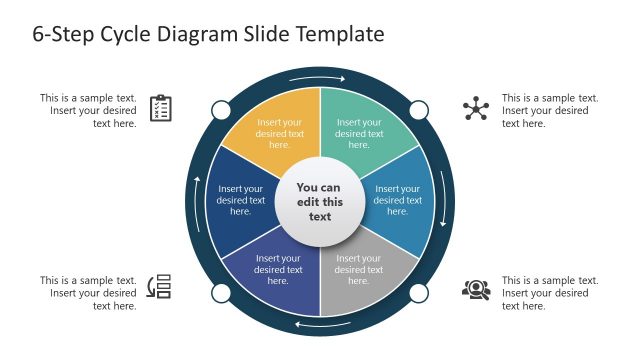
A: The circular layout reinforces Six Sigma as an ongoing improvement loop rather than a one-time checklist. Segmented donut shapes make each phase distinct, while the arrows imply movement from one activity to the next. The exploded blue version adds emphasis when the presenter wants to discuss phase boundaries, handoffs, or accountability.


Six Sigma Diagram for PowerPoint
6-slide PowerPoint diagram template for Six Sigma cycle road maps and segmented donut layouts
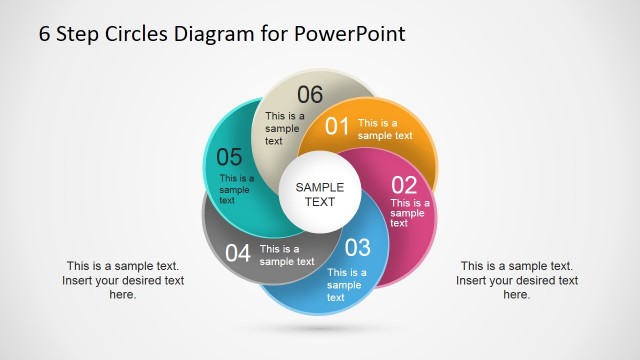
Six Sigma Diagram for PowerPoint is a 6-slide diagram template for presenting the DMAIC-style quality improvement cycle. It includes a circular road map, colored and blue segmented donut layouts, exploded cycle variants, and versions with a right-side text box for notes. It is intended for quality, operations, and process improvement presenters.

 Loading...
 Microsoft PowerPoint
  Microsoft Copilot
  Claude for PowerPoint
 Other formats supported
Subscribe today and get immediate
access to download our PowerPoint templates.