Slide 2 of 6 from Six Sigma Diagram for PowerPoint
six-sigma-powerpoint-2
Six Sigma Circular Diagram for Presentations
- Diagram
- Circular Cycle
- Process Slide
- 16:9
- 100% Editable
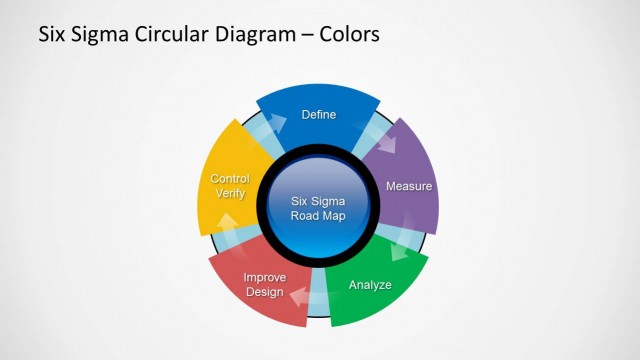
The Six Sigma Circular Diagram slide from the Six Sigma Diagram for PowerPoint template offers a clear visual of the DMAIC process, ideal for business presentations focused on quality improvement. This slide layout includes editable shapes and vector icons arranged in a circular flow, supporting effective communication in project management meetings and process training sessions. It integrates seamlessly into corporate presentation slide decks, enhancing understanding of complex methodologies through professional slide templates.
What’s on This Slide
The slide features a circular diagram divided into six segments, each labeled with a phase of the Six Sigma process: Define, Measure, Analyze, Improve Design, Control Verify, and a central node labeled 'Six Sigma Road Map.' The segments are colored in shades of blue, with arrows indicating the flow between them. The diagram is centered on the slide, with a light background enhancing visibility. Text placeholders are positioned at the top for the title and may include additional notes or explanations in the future.
How to Use It
This layout serves as a visual representation of the Six Sigma DMAIC process, ideal for quality improvement presentations. It fits well after introductory content, providing a clear overview of the methodology. Suitable for business contexts such as operational efficiency discussions, training sessions, or project management meetings, this diagram helps convey complex processes in a simplified manner, making it easier for audiences to grasp key concepts.
Text Placeholders & Capacity
Keep your copy within these limits so it fits without resizing. Node labels can hold roughly 2-3 words each.
| Placeholder | Count | Max characters (approx.) |
|---|---|---|
| Slide title | 1 | 30 |
| Item heading | 6 | 20 |
| Item body | 1 | 50 |
Slide Keywords
Download unlimited PowerPoint templates, charts and graphics for your presentations with our annual plan.
DOWNLOADReturn to Six Sigma Diagram for PowerPoint.