Slide 4 of 6 from Six Sigma Diagram for PowerPoint
six-sigma-powerpoint-4
Six Sigma Circular Diagram for Presentations
- Diagram
- Circular Cycle
- Process Slide
- 16:9
- 100% Editable
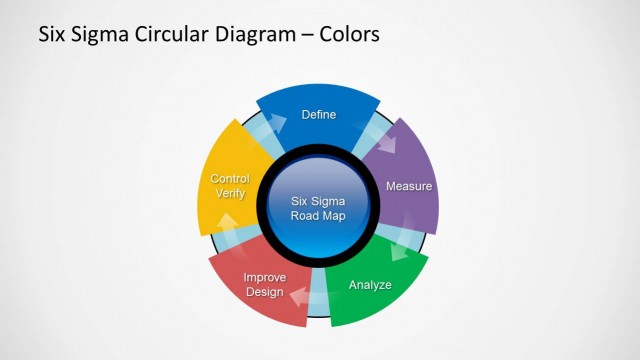
The Six Sigma Circular Diagram slide from the Six Sigma Diagram for PowerPoint template visually outlines the DMAIC process phases, making it suitable for business presentations on quality management and operational excellence. This slide uses editable shapes and vector icons to clearly depict the continuous flow of Define, Measure, Analyze, Improve, and Control stages, enhancing understanding in process improvement training and corporate presentations.
What’s on This Slide
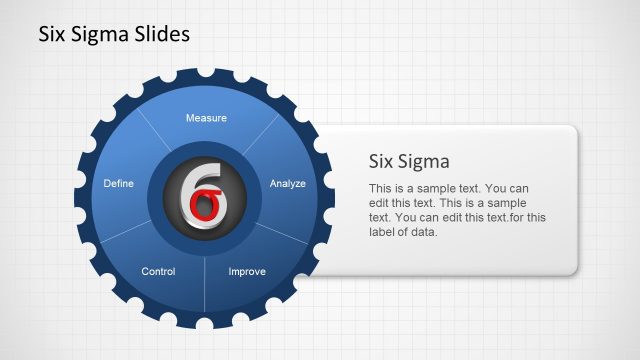
The layout features a circular diagram divided into five segments, each labeled with a Six Sigma phase: Define, Measure, Analyze, Improve, and Control. The segments are color-coded and arranged in a clockwise direction, with arrows indicating flow between them. At the center is a circular label stating 'Six Sigma Road Map.' To the right, there is a rectangular textbox with a blue background, containing a sample text placeholder, aligned vertically. The overall composition emphasizes the circular flow of the Six Sigma process, with clear visual hierarchy.
How to Use It
This layout serves as a visual representation of the Six Sigma DMAIC process, ideal for quality management presentations. It fits well after introducing quality improvement concepts, providing a structured overview of the process. Use this diagram to explain each phase's role in achieving quality goals. It is suitable for business meetings, training sessions, or project updates focused on process improvement and operational excellence.
Text Placeholders & Capacity
Keep your copy within these limits so it fits without resizing. Node labels can accommodate short phrases, roughly 2-3 words each.
| Placeholder | Count | Max characters (approx.) |
|---|---|---|
| Slide title | 1 | 30 |
| Item heading | 5 | 15 |
| Body paragraph | 1 | 150 |
Slide Keywords
Download unlimited PowerPoint templates, charts and graphics for your presentations with our annual plan.
DOWNLOADReturn to Six Sigma Diagram for PowerPoint.