Slide 3 of 6 from Six Sigma Diagram for PowerPoint
six-sigma-powerpoint-3
Six Sigma Circular Diagram for Presentations
- Diagram
- Circular Cycle
- Process Slide
- 16:9
- 100% Editable
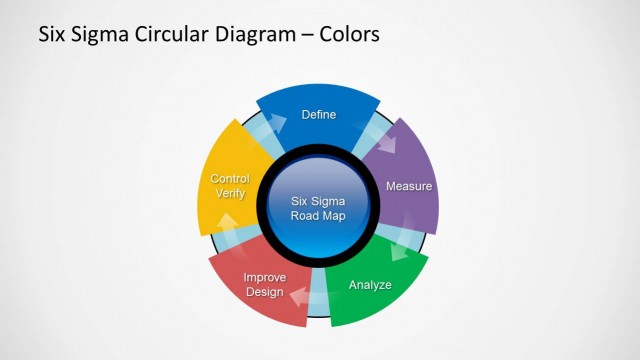
The Six Sigma Circular Diagram slide from the Six Sigma Diagram for PowerPoint template visually represents the continuous DMAIC process using editable shapes and vector icons. This slide layout is ideal for business presentations and training sessions focused on quality management and process improvement, offering clear, professional slide templates to illustrate each phase of Six Sigma in a corporate presentation or workshop setting.
What’s on This Slide
The layout features a central circular element labeled 'Six Sigma Road Map' surrounded by six segments. Each segment displays a phase of the Six Sigma process: Define, Measure, Analyze, Improve Design, Control Verify, and a placeholder for additional text. The segments are arranged in a circular pattern with arrows indicating flow direction. The color scheme is predominantly blue, with a gradient effect. The background is light, enhancing visibility. Text placeholders are positioned in each segment, aligned centrally, allowing for clear labeling of each phase.
How to Use It
This layout functions as a circular diagram to illustrate the Six Sigma process in a presentation. It is suitable for quality management discussions, process improvement workshops, or training sessions. The circular format emphasizes the continuous nature of the Six Sigma methodology. This slide fits well in a sequence that introduces quality improvement concepts or follows a problem identification slide. It can be used to explain the DMAIC framework in various business contexts.
Text Placeholders & Capacity
Keep your copy within these limits so it fits without resizing. Node labels can hold up to 20 characters each, while the body text can accommodate around 50 characters.
| Placeholder | Count | Max characters (approx.) |
|---|---|---|
| Item heading | 6 | 20 |
| Item body | 1 | 50 |
| Slide title | 1 | 40 |
Slide Keywords
Download unlimited PowerPoint templates, charts and graphics for your presentations with our annual plan.
DOWNLOADReturn to Six Sigma Diagram for PowerPoint.