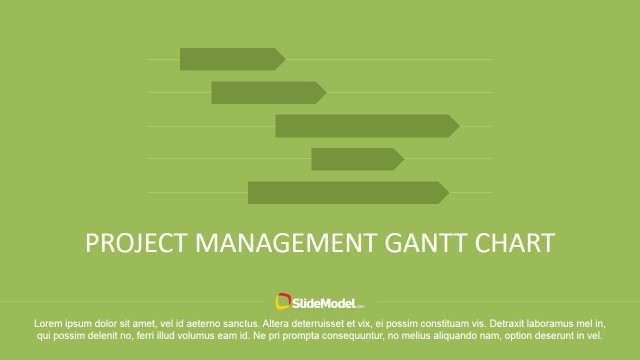
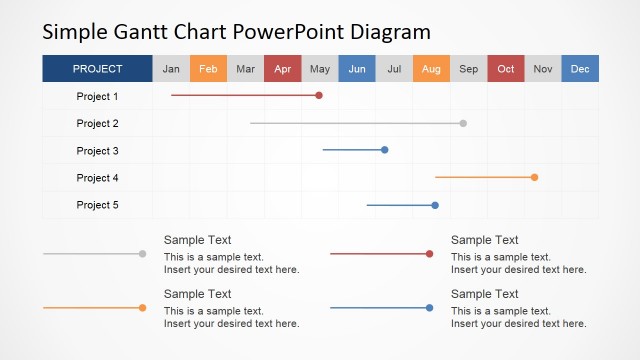
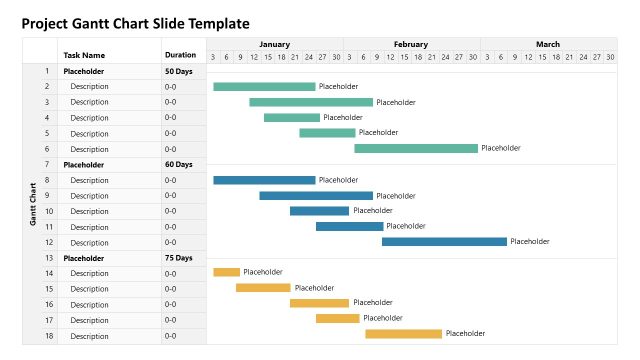
PERT Chart Template for PowerPoint is a presentation template containing useful PERT chart diagrams for project planning and project management presentations.
The Program Evaluation and Review Technique is a statistical tool used in project management. This PERT tool is designed to help visualize and analyze the the tasks involved in completing a given project or program. It can be used with other techniques like the critical path method.
What’s inside this template
Example presentation scenarios
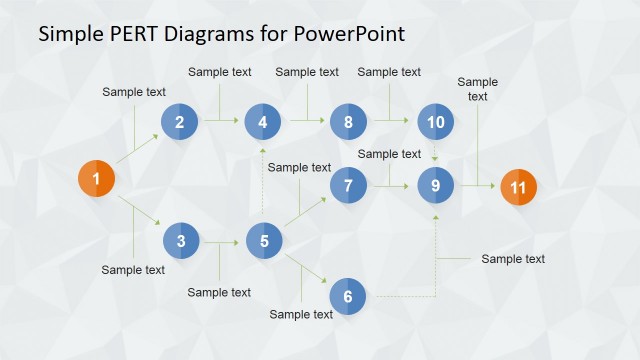
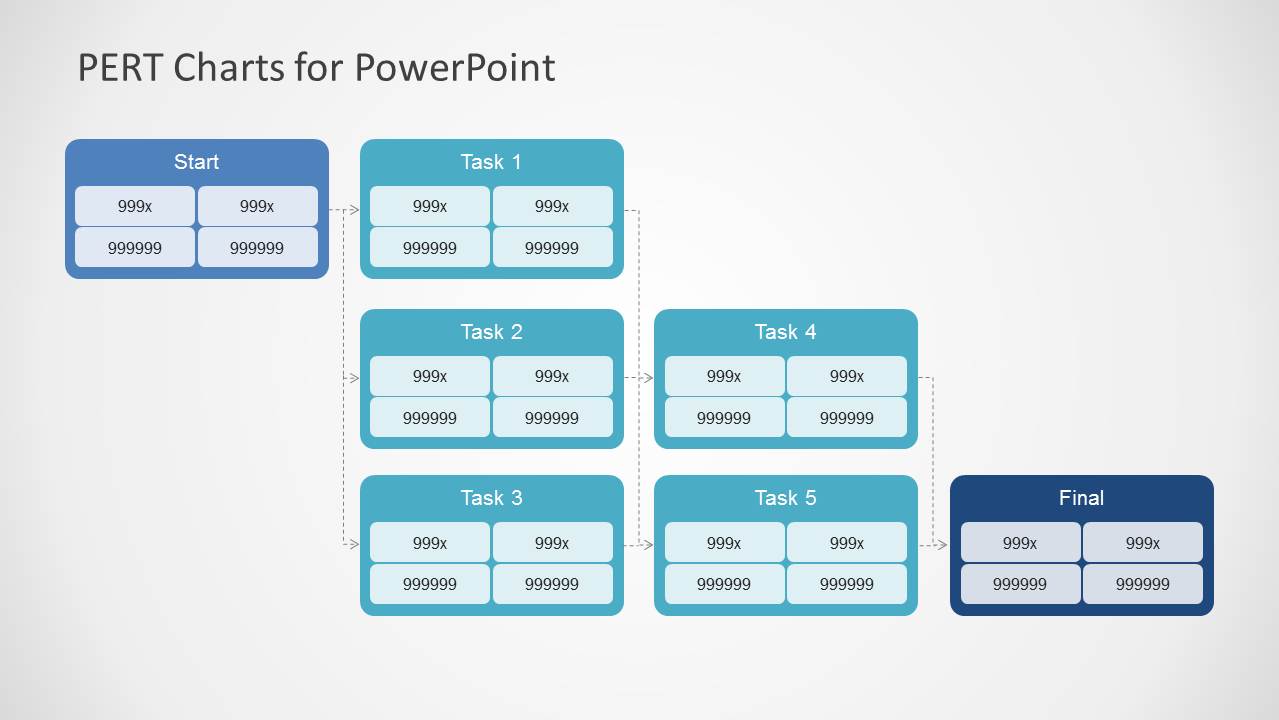
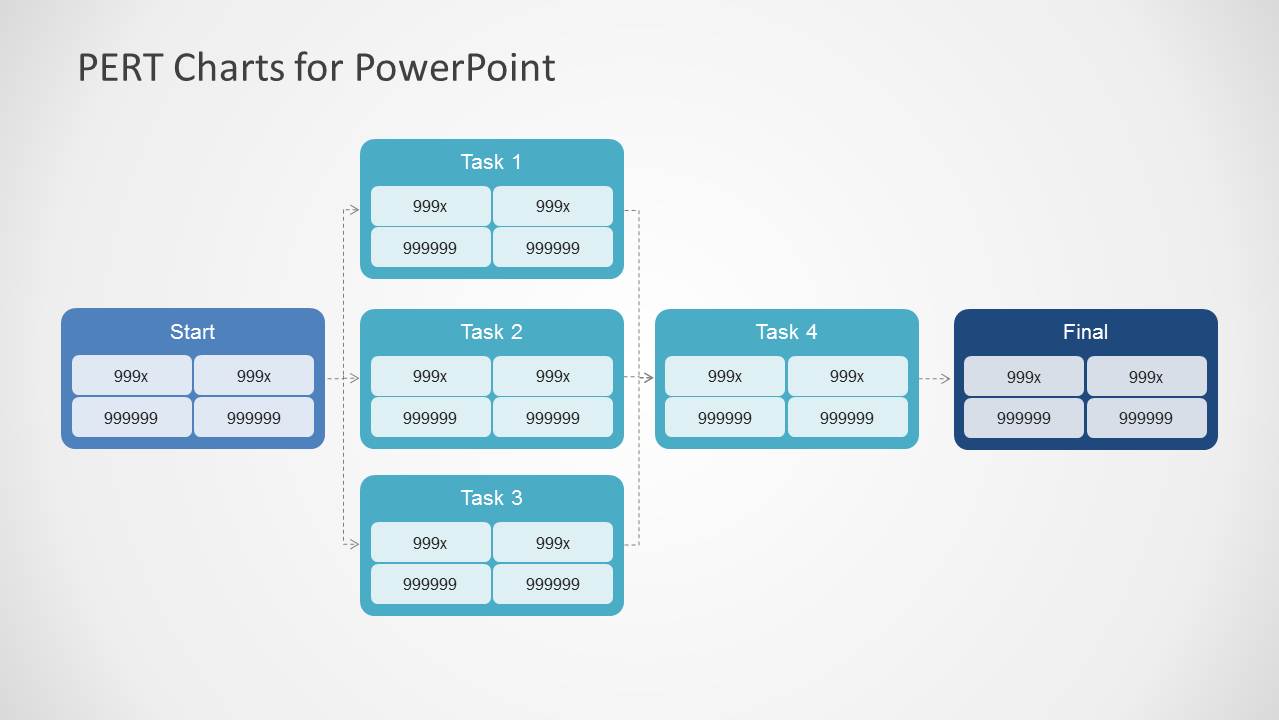
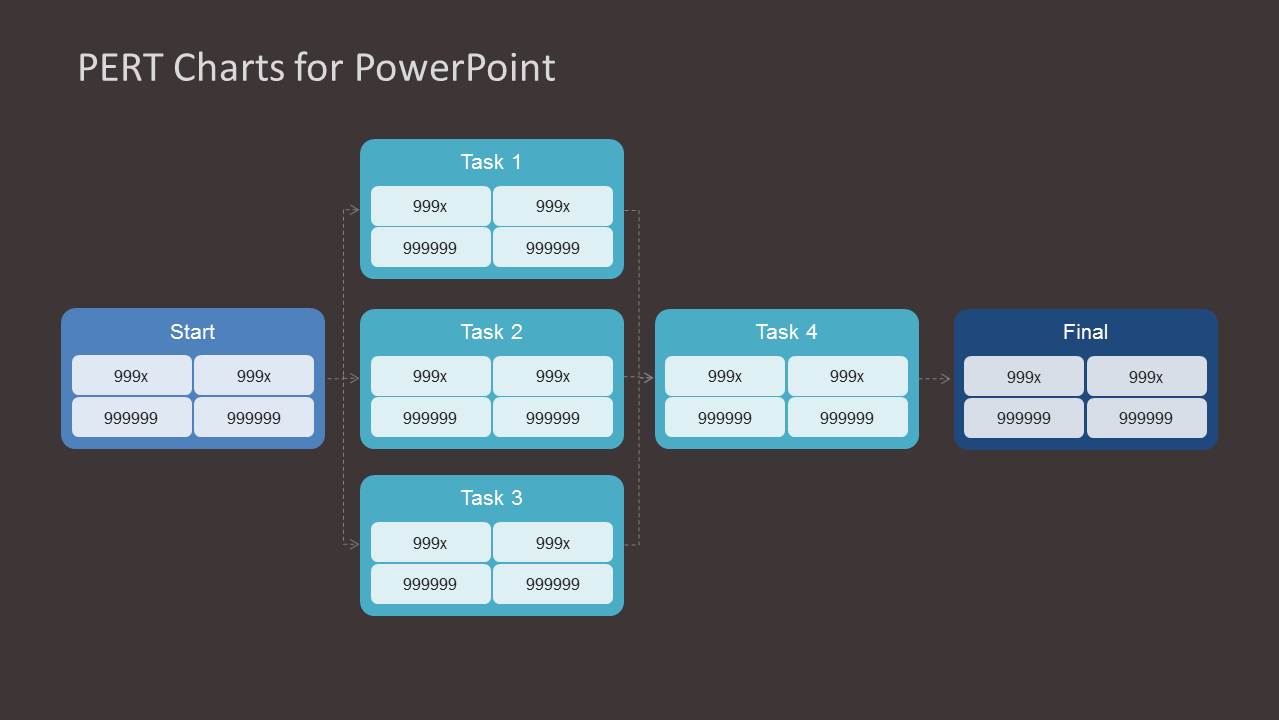
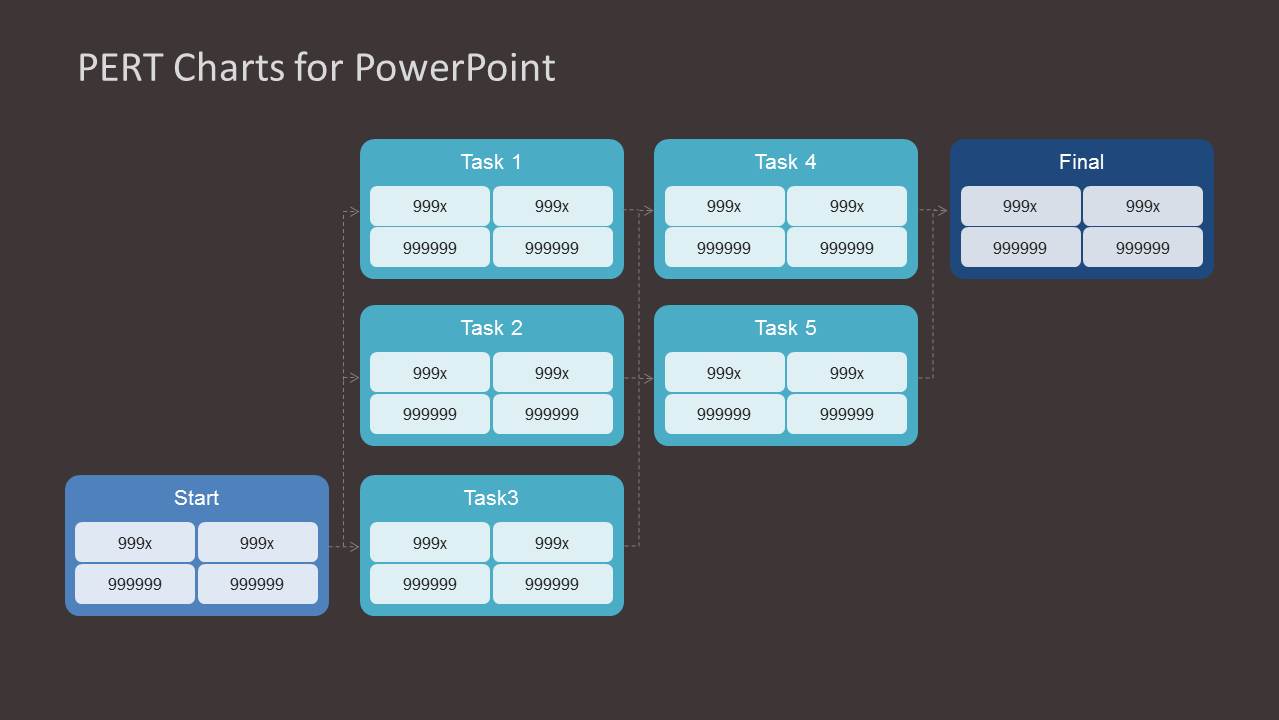
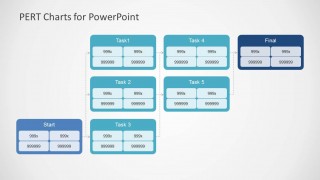
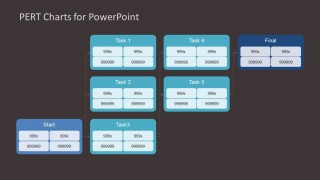
- A project manager can use the parallel task PERT network to show stakeholders which activities can run at the same time and which tasks must finish before the final milestone.
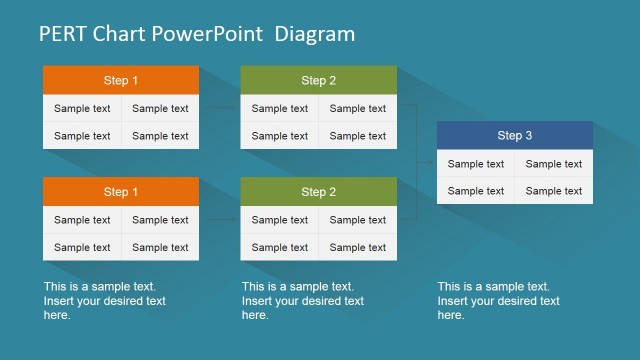
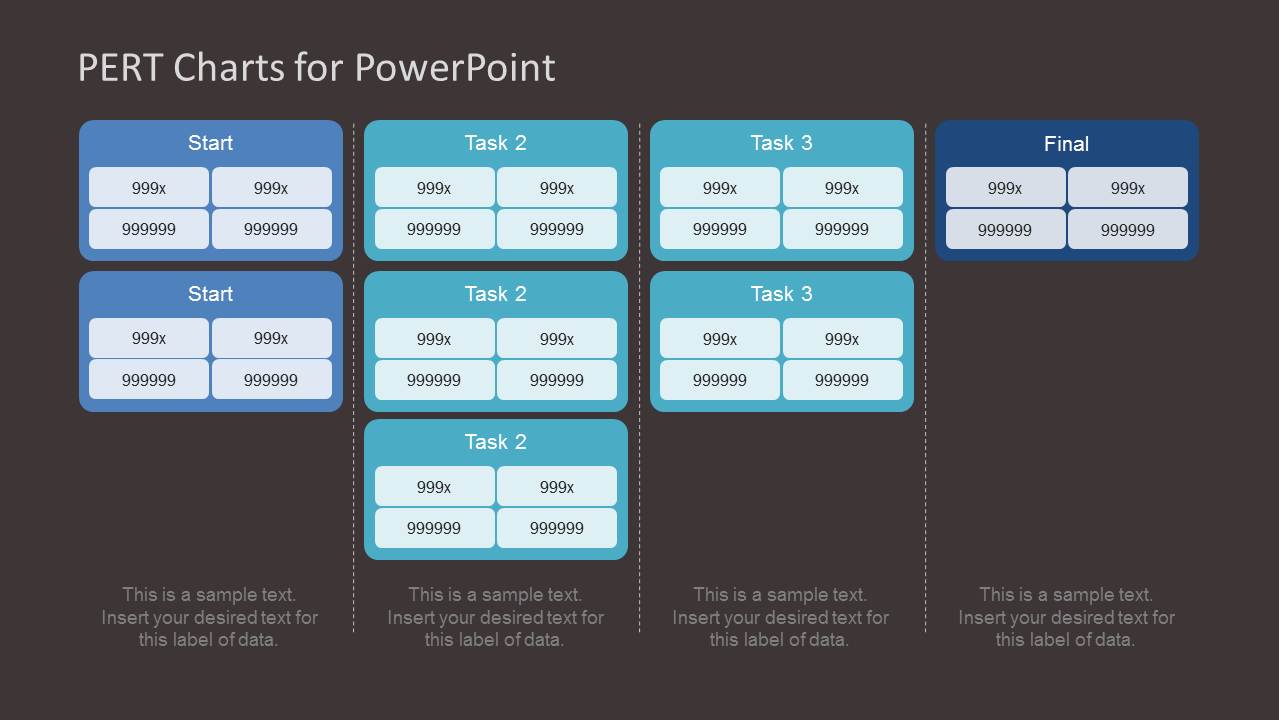
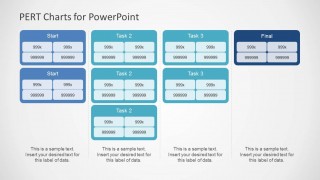
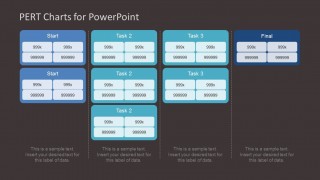
- A PMO lead can use the captioned column layout to compare phases, add explanatory notes under each task group, and align the team on schedule assumptions.
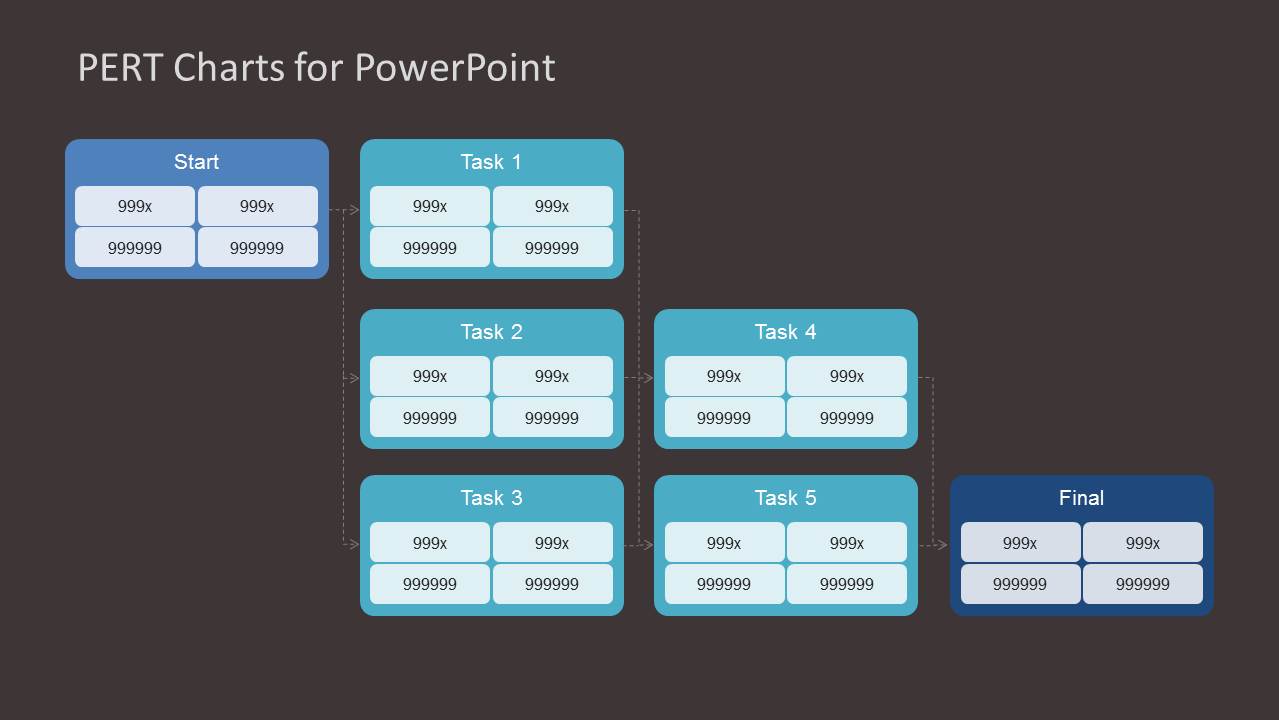
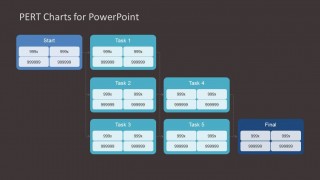
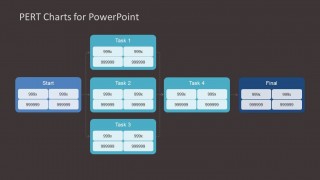
- An operations consultant can use the dark-background dependency diagram to present a critical path method recommendation during an executive review.
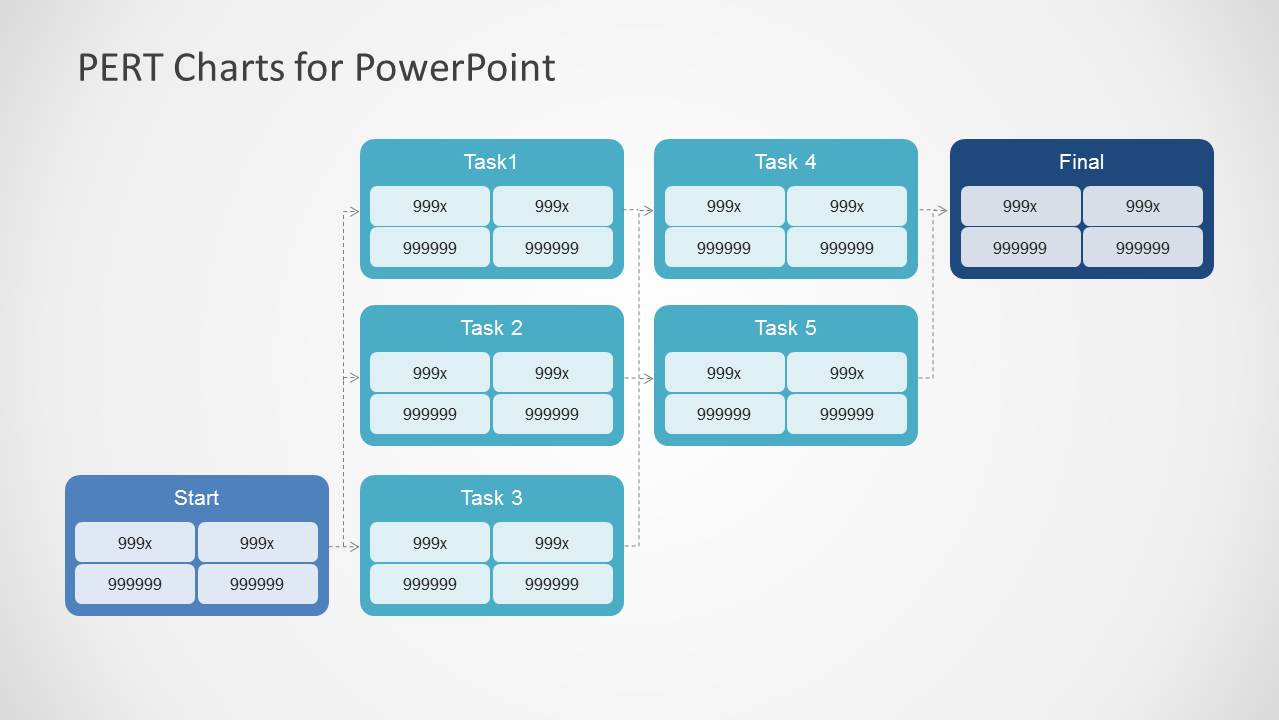
- An engineering lead can use the branching Start-to-Final layouts to explain task sequencing, dependencies, and handoffs before a project kickoff.
Features
- 100% editable presentation template
- Compatible with Microsoft PowerPoint
- 16:9 aspect ratio slides
- Scalable vector shapes, icons and illustrations
- AI-Ready for Microsoft Copilot and Claude
- Instant access and download
Frequently asked questions
Q: How should a presenter explain a PERT chart without overwhelming the audience?
A: Start with the Start and Final nodes, then trace only one dependency path at a time. Use the internal fields in each task box for concise values such as duration, early start, late finish, or owner. For executive audiences, highlight the longest or most constrained path before discussing secondary branches.
Q: Who is this template best suited for in a project planning meeting?
A: This template fits project managers, PMO leads, consultants, and operations teams that need to explain activity relationships before schedule execution. The PERT network layouts are strongest when the audience must understand task dependency, sequencing risk, and possible critical path implications rather than a date-by-date work plan.
Q: Why do these layouts use connected task nodes instead of a simple task list?
A: The node-and-connector structure turns a task list into a dependency map. Viewers can see which tasks branch, converge, or depend on earlier work before the final milestone. The light and dark versions also let presenters choose the contrast level that best supports the meeting setting.

PERT Chart Template for PowerPoint
8-slide PERT chart presentation template for project tasks, critical path planning, and CPM communication.
PERT Chart Template for PowerPoint is an 8-slide diagram template for project planning in Microsoft PowerPoint. It includes editable PERT network diagrams, start and final milestone nodes, parallel task branches, and captioned task-column layouts. Project managers can map dependencies, sequence work, and explain critical path logic.
- Category
- Diagrams
- Rating

 Loading...
- Aspect ratio
- 16:9
- Item ID
- 6171-02
- Colors
 Microsoft PowerPoint
  Microsoft Copilot
  Claude for PowerPoint
 Other formats supported
Subscribe today and get immediate
access to download our PowerPoint templates.