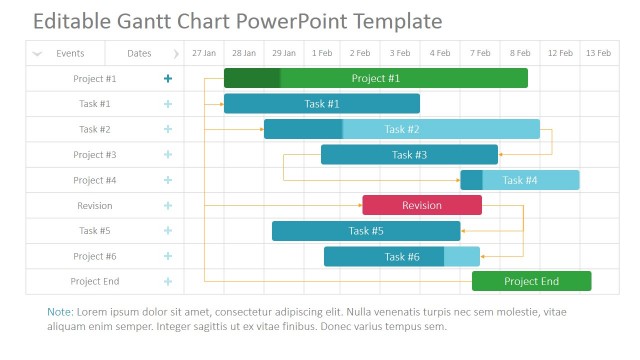
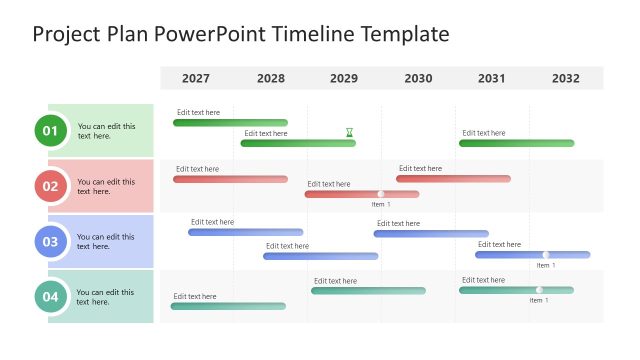
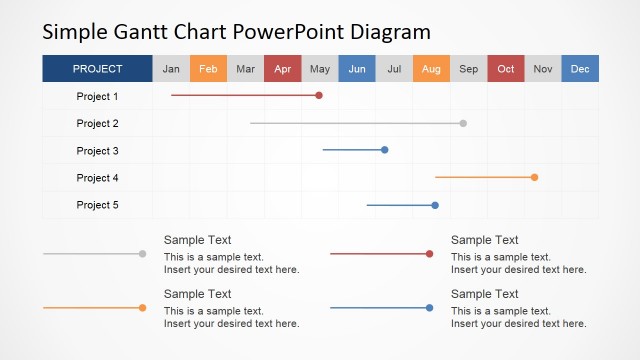
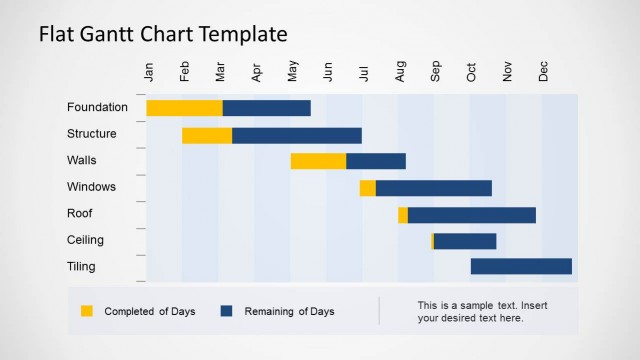
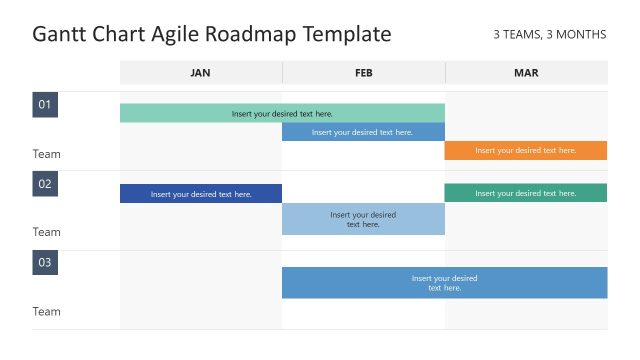
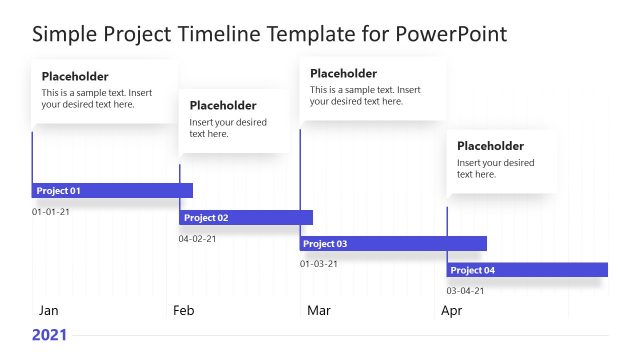
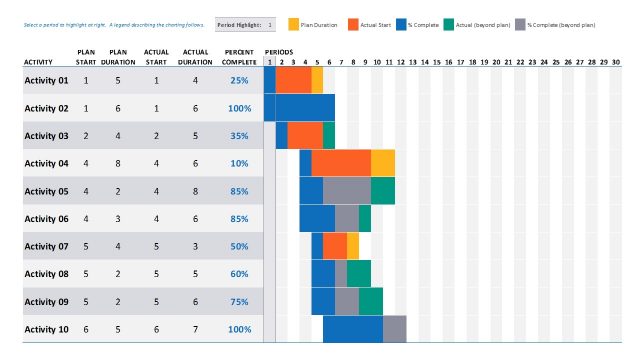
Outline your project activities clearly with our Project Gantt Chart Slide Template in your team meetings. A Gantt chart is a project management tool that allows professionals to visualize the project timeline and tasks. It presents a list of activities, groups of functions, the start and end dates of specific activities, and the duration or dependencies of all tasks in a bar chart format. This enables team members to understand each other’s responsibilities and deadlines, thereby boosting project performance and productivity. We have developed this bar chart format with colorful labels using editable PowerPoint components. You can also edit this design in Google Slides and Keynote.
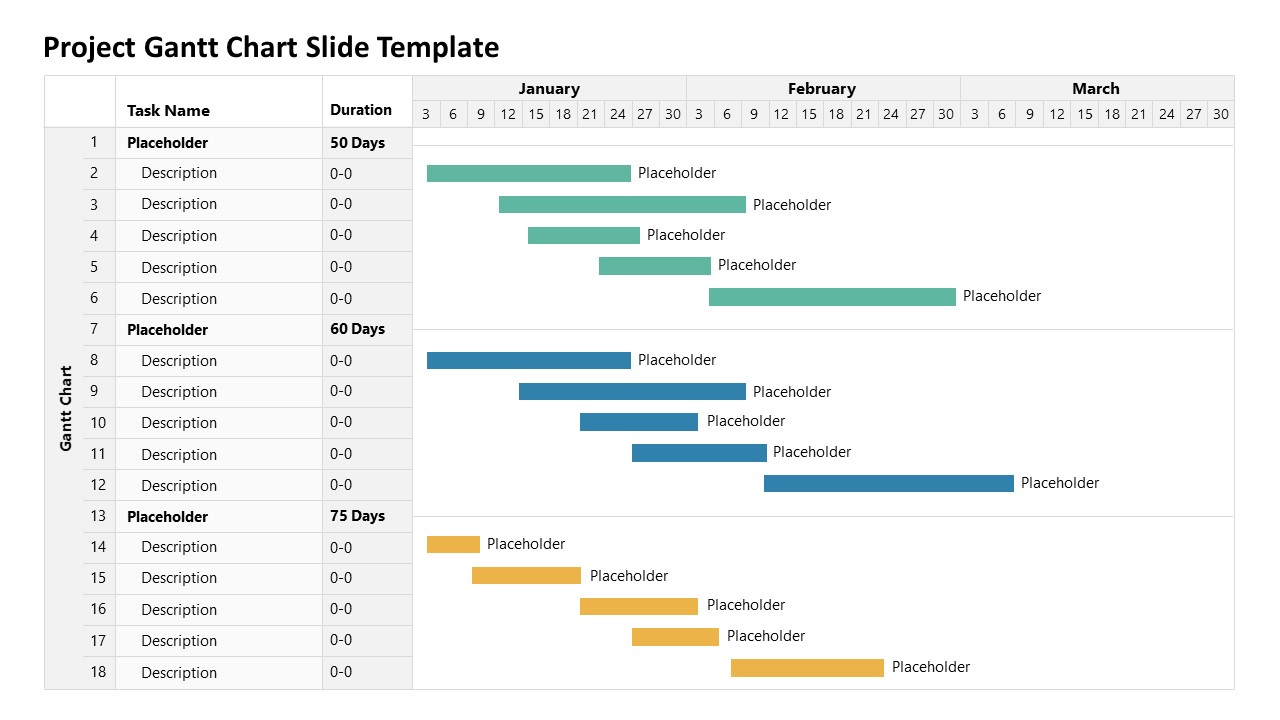
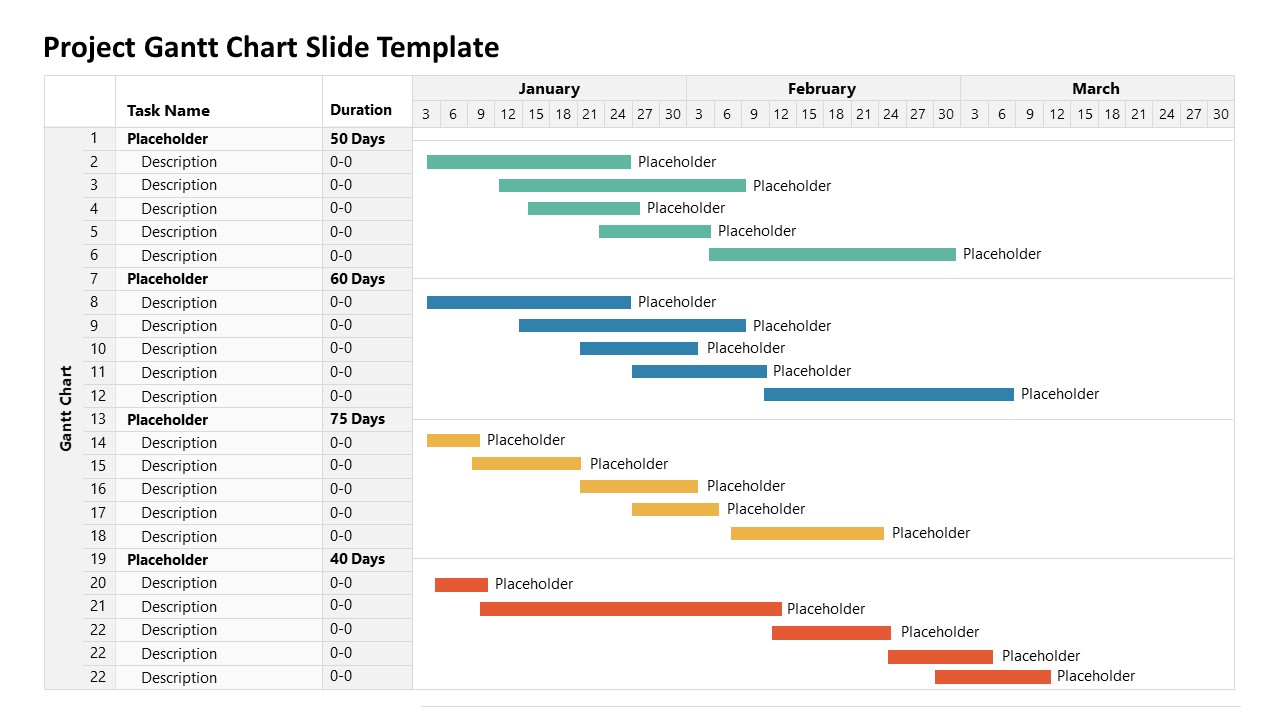
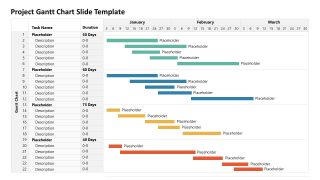
The Project Gantt Chart Slide Template has two slides with a similar layout but with slight variations. The first slide has four columns with many rows. The leftmost column is for the serial number. Then we have columns for task name and duration. The last column is for months, which have subcolumns for dates. You can easily present the start and end dates of the project, such as from January 1st to February 15th. The second slide has exactly the same design, but has more rows and tasks than the first one. Secondly, you can also color-code the tasks, using green for completed tasks, red for pending tasks, and blue for in-progress actions. The project Gantt charts are used for effective project scheduling and identifying potential bottlenecks or conflicting actions. Project managers can utilize Gantt chart templates to monitor the progress of their business projects.
You can also customize the PPT design by changing the fonts, colors, or icons to suit your needs. Download the project Gantt chart slide PPT template and personalize it today!
What’s inside this template
Example presentation scenarios
- A project manager can use the Gantt chart table to brief stakeholders on task timing, durations, and phase sequencing before work begins.
- A team lead can present the monthly timeline and color-coded bars during a weekly meeting to explain which activities are active, delayed, or upcoming.
- An operations manager can use the expanded task list on Slide 2 to review a larger work plan with more rows and grouped activities.
- A consultant can include the schedule table in a project brief to show clients how deliverables are distributed across January, February, and March.
Features
- 100% editable presentation template
- Compatible with Microsoft PowerPoint and Google Slides
- 16:9 aspect ratio slides
- Scalable vector shapes, icons and illustrations
- AI-Ready for Microsoft Copilot and Claude
- Instant access and download
Frequently asked questions
Q: How should a presenter explain this Gantt chart without overwhelming the audience?
A: Start with the task groups on the left, then move across the calendar to explain timing. Call attention to one color group at a time instead of reading every row. The horizontal bars are best used to show overlaps, handoffs, and duration patterns, while the task and duration columns provide supporting detail.
Q: Who is this template best suited for in a project meeting?
A: This template is strongest for project managers, team leads, and consultants who need to align a group around dates and responsibilities. It works well when the audience must see the connection between activity names, durations, and scheduled work across months rather than only hearing a verbal project update.
Q: Why does the table-and-bar Gantt layout communicate project plans effectively?
A: The left-side table gives structure, while the right-side timeline turns task duration into a visual span. This pairing helps audiences compare planned work horizontally across time and vertically across task groups. The color-coded bars create phase separation, making bottlenecks and overlapping work easier to identify during discussion.
Project Gantt Chart Slide Template
2-slide presentation template with Gantt chart schedules, task lists, and monthly planning timelines
The Project Gantt Chart Slide Template is a 2-slide planning template for project managers and team leads. It shows editable Gantt chart schedule tables with task lists, duration columns, monthly timeline headers, and color-coded activity bars. The 16:9 slides are designed for Microsoft PowerPoint and Google Slides.
- Category
- Timelines & Planning
- Rating

 Loading...
- Aspect ratio
- 16:9
- Item ID
- 22389-01
 Microsoft PowerPoint
  Microsoft Copilot
  Claude for PowerPoint
 Other formats supported
Subscribe today and get immediate
access to download our PowerPoint templates.