PEST Analysis Diagrams for PowerPoint is a selection of outstanding PowerPoint designs on business concepts. PEST stands for Political, Economic, Social and Technological factors of an organization or company. The slides contain colorful shapes and diagrams. The comprehensive graphics can surely aid the audience towards high information retention.
PEST Analysis is a strategic tool that scans the environment for threats and opportunities. The first step is identifying the elements that affect change in the environment. Unlike SWOT Analysis, PEST Analysis is done in a bigger scale or a more general perspective. Each component is analyzed before the final elements are entered in the diagram. A political has to be done before results can be written in the Political portion of the diagram. The model can help the user evolve the business to allow positive changes. The determined threats can be avoided by not accommodating projects that are not feasible to the working environment. It develops an objective point of view and removes bias.
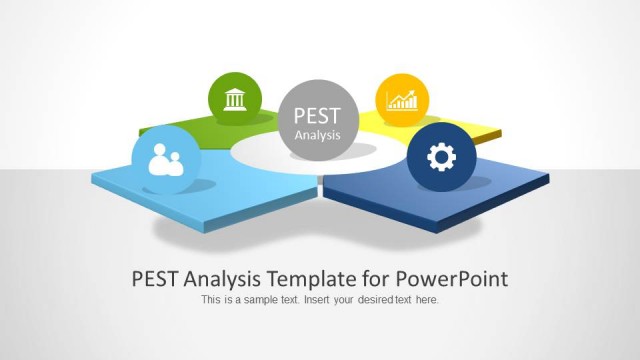
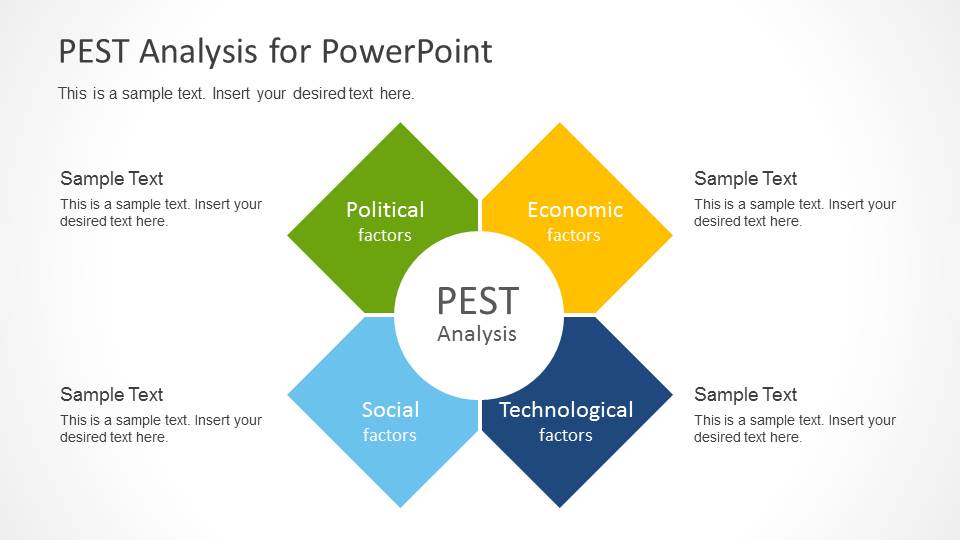
There are 3 slides in the PowerPoint template. The first slide shows a circle in the center that contains the title or main topic. It is surrounded by 4 overlapping diamonds. These are labelled and colored as the following:
Political factors- green
Economic factors- yellow
Social factors- light blue
Technological factors- dark blue
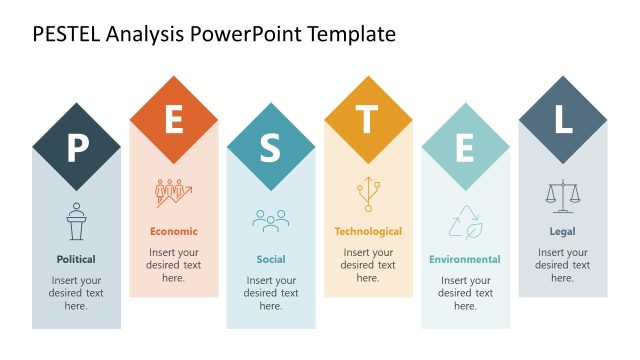
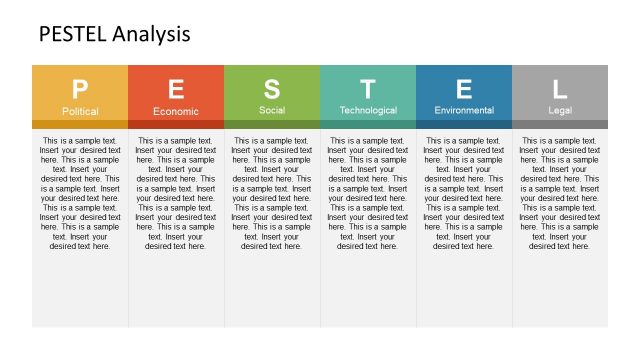
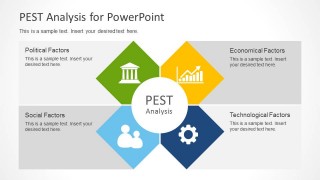
The second slide features meaningful icons that symbolize the PEST components. Corresponding text boxes are placed alongside these icons. Finally, the 3rd slide has a unique layout with horizontal, colored text placeholders.
The perfect use PEST Analysis Diagrams for PowerPoint is in presenting the components of PEST Analysis in graphical forms. The diagrams can be independent presentations. They can supplement broader ideas or complement a SWOT Analysis. The tool can be used in a business or personal level.
Standard reports can be enhanced by stunning visuals from PEST Analysis Diagrams for PowerPoint. PEST Analysis PowerPoint Template is a 3D collection downloadable from the SlideModel gallery.
What’s inside this template
Example presentation scenarios
- A strategy consultant can use the four-diamond PEST diagram to introduce Political, Economic, Social, and Technological factors before discussing how each affects a client decision.
- A corporate planning team can use the icon-based quadrant matrix to organize workshop findings and compare external pressures in a single visual frame.
- A product manager can use the hub-and-spoke factor list to summarize market forces for stakeholders before a roadmap or investment discussion.
- An instructor can use the color-coded PEST layouts to teach students how macro-environmental categories differ from internal analysis tools.
Features
- 100% editable presentation template
- Compatible with Microsoft PowerPoint and Google Slides
- Scalable vector shapes, icons and illustrations
- AI-Ready for Microsoft Copilot and Claude
- Instant access and download
Frequently asked questions
Q: How should a presenter use these PEST diagrams to make the analysis clear?
A: Start with the four-diamond diagram to define the four PEST categories, then move to the icon-based quadrant matrix for factor details. Keep each text block short and action-oriented. Use the hub-and-spoke list as a recap, so the audience leaves with the main external forces rather than a long list of observations.
Q: Who is this template best suited for in a business presentation?
A: This template fits consultants, strategy teams, product managers, and educators who need to explain macro-environmental conditions without building a full strategic report. It works best when the goal is to frame Political, Economic, Social, and Technological factors before a decision, planning workshop, market entry discussion, or risk review.
Q: Why do the diamond, quadrant, and spoke layouts help communicate PEST analysis?
A: The repeated color coding keeps the four categories recognizable across slides, while the central PEST circle reinforces that the factors belong to one external environment model. The diamond layout shows balance, the quadrant matrix supports comparison, and the spoke list turns the analysis into a concise summary the audience can scan quickly.


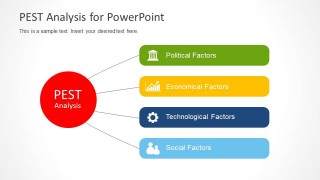
PEST Analysis Diagrams for PowerPoint
3-slide PowerPoint presentation template for PEST analysis diamonds, icon quadrants, and factor lists
PEST Analysis Diagrams for PowerPoint is a 3-slide business strategy template for presenting Political, Economic, Social, and Technological factors. It includes a four-diamond PEST diagram, an icon-based quadrant matrix, and a hub-and-spoke factor list for consultants, strategists, and business presenters working in PowerPoint.
- Category
- Business PowerPoint Templates
- Rating


 Loading...
- Item ID
- 6118-02
- Colors
 Microsoft PowerPoint
 Microsoft Copilot
 Claude for PowerPoint
Other formats supported
Subscribe today and get immediate
access to download our PowerPoint templates.