PERT Chart PowerPoint Diagram
PERT Chart PowerPoint Diagram is a modern Flat Design Template containing different combinations of PERT Charts.
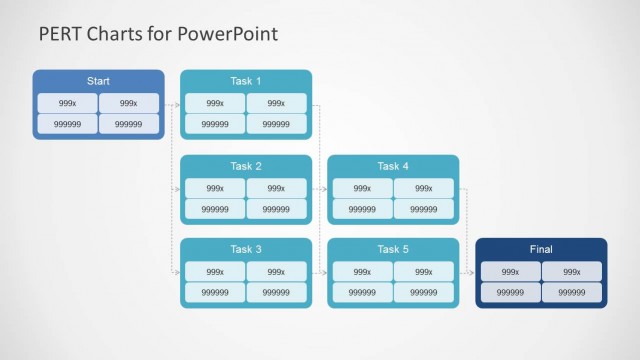
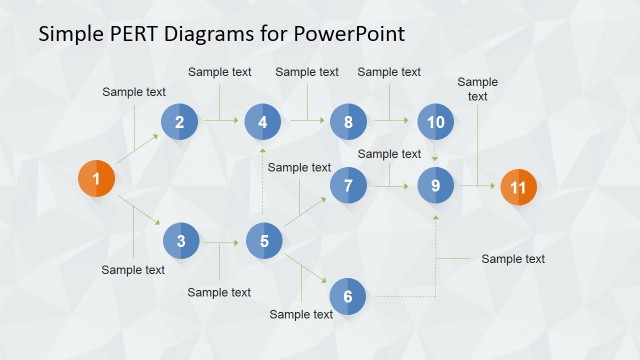
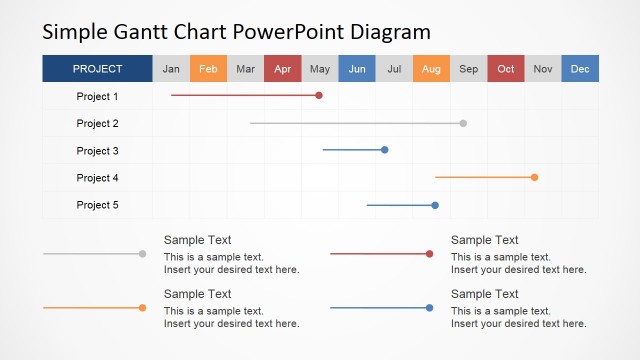
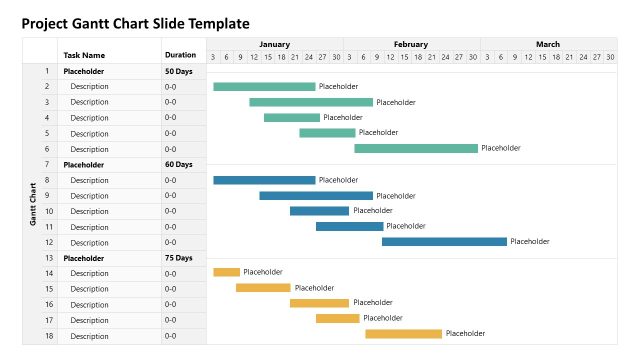
PERT is the acronym for “Program Evaluation Review Technique” which is one of the most wide spread project management and control statistical tools within the Project Management Field. The PERT chart tool is used for scheduling, organizing and coordinating task within a project. It is generally used with the Critical Path Method, which determines the path of tasks that cannot be delayed within a project without affecting a milestone.
The PERT technique is based in the concepts of estimating the shortest time each task will take, the most likely length and the longest time that might be taken if the tasks takes longer than expected.
The following formula is used to calculate the time for each project stage:
- Shortest Time (ST): Minimum possible time required to finish a task, assuming overestimations and everything proceeds exceeding expectations.
- Longest Time (LoT): Maximum possible time required to finish a task, assuming sub estimation everything goes under expectations, without major impact.
- Likely Time (LiT): Best estimate possible of time required to accomplish the task, assuming everything is up to expectations.
( ST + 4*LiT + LoT) / 6
This helps to bias time estimates away from the unrealistically short time-scales normally assumed.
It was first introduced by the US Navy for their military projects and acquired in the 80’s as formal practice under different project management organizations.
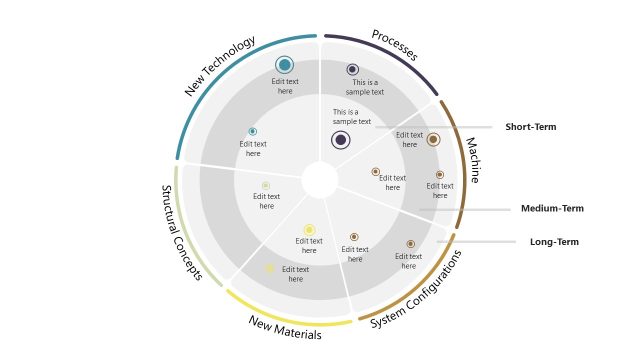
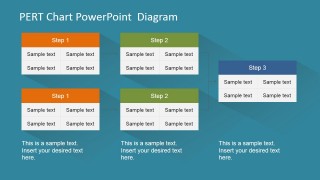
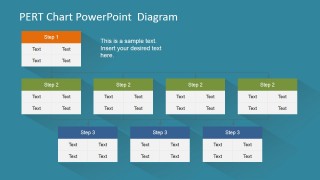
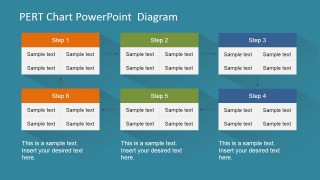
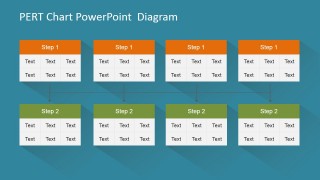
Every PERT node in out PERT chart is created using PowerPoint tables, allowing the user to fully customize their appearance as size, color and effects. The activity arrows are created using PowerPoint connectors, enabling the user to move nodes around the slide without loosing connection of the chart.
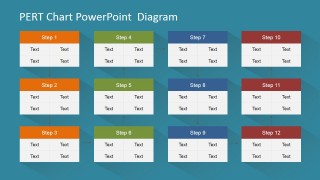
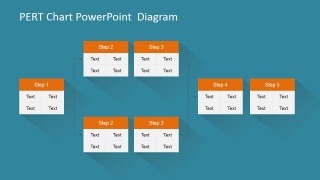
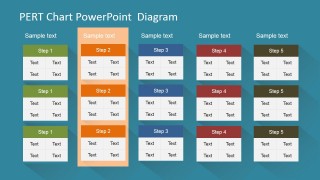
Each slide provides a different PERT chart scenario, that the user can combine to create their own diagram.
Impress your audience with this modern PERT Chart PowerPoint Diagram that appeals to executives audiences.


You must be logged in to download this file.
DOWNLOAD- Category
- Diagrams
- Rating

 Loading...
- Size
- 16x94x3
- Item ID
- 6575-01
- Colors
Subscribe today and get immediate
access to download our PowerPoint templates.