Data Elements for PowerPoint Presentations
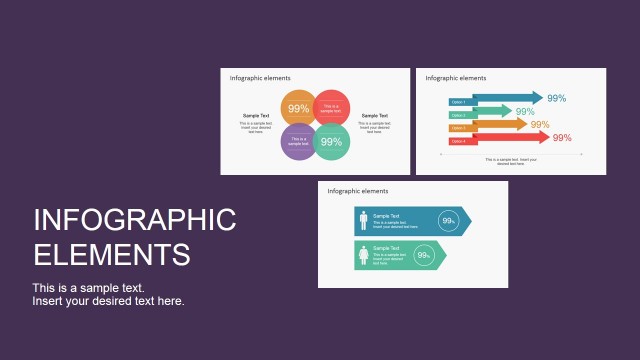
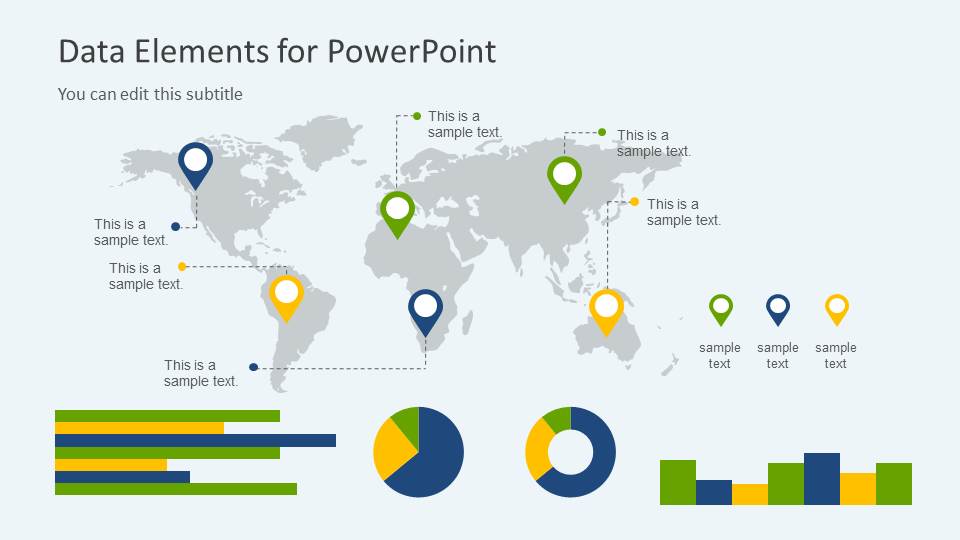
Data Elements for PowerPoint presentations contains 6 unique slide designs with different data-driven chart concepts for PowerPoint presentations and data elements.
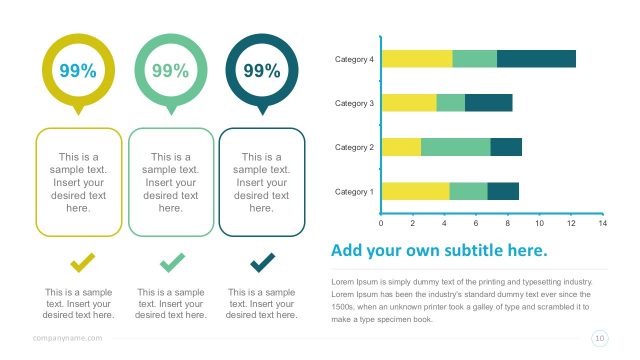
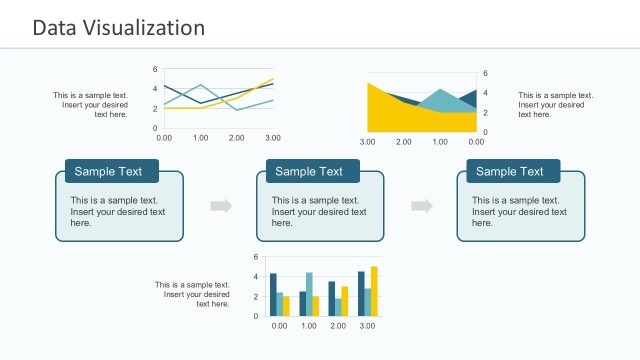
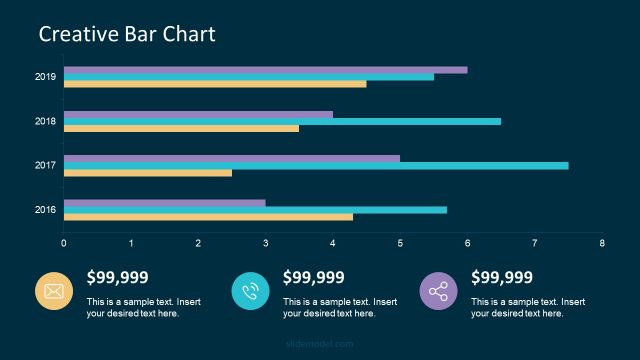
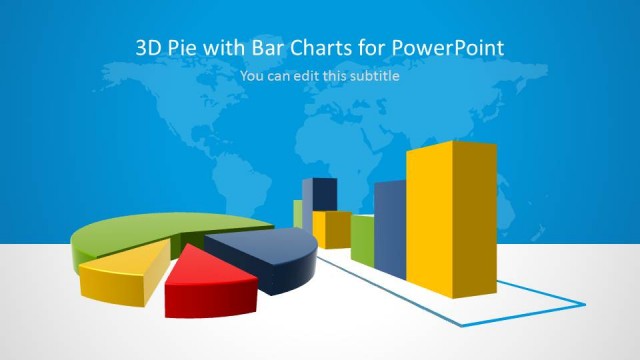
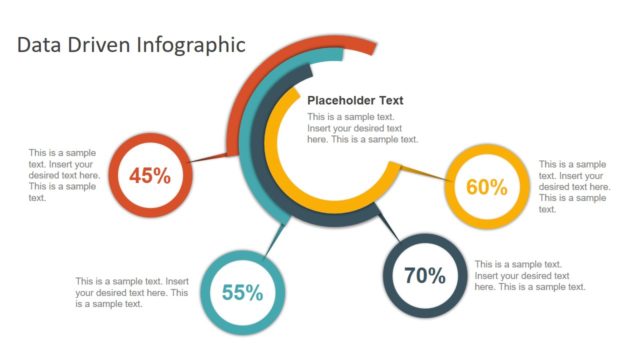
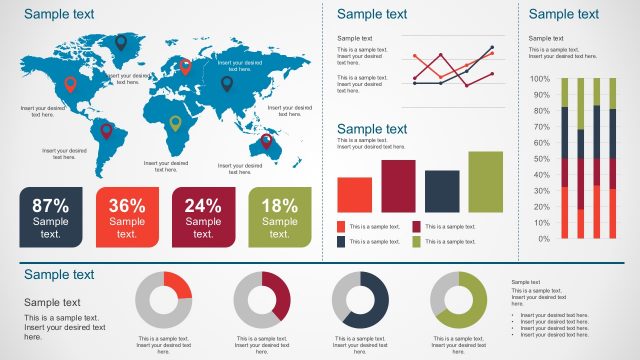
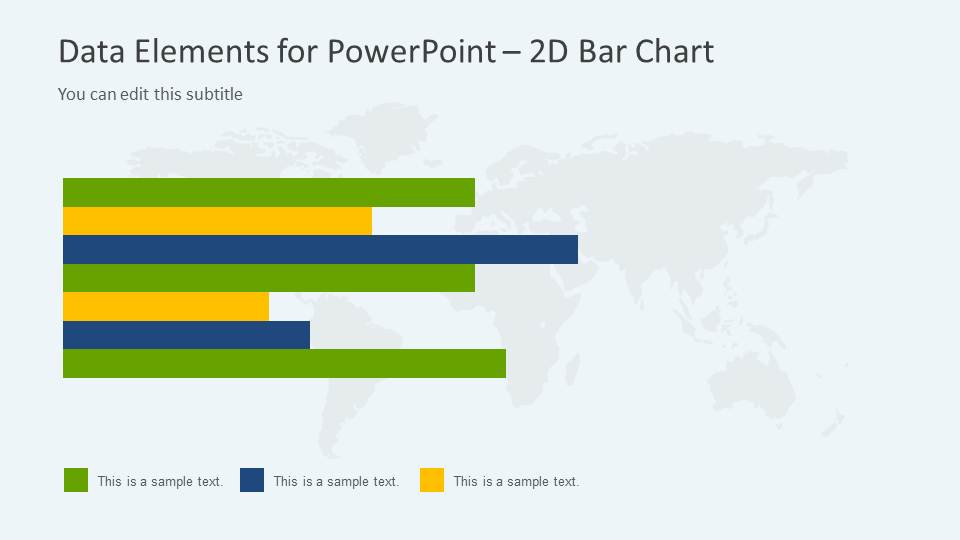
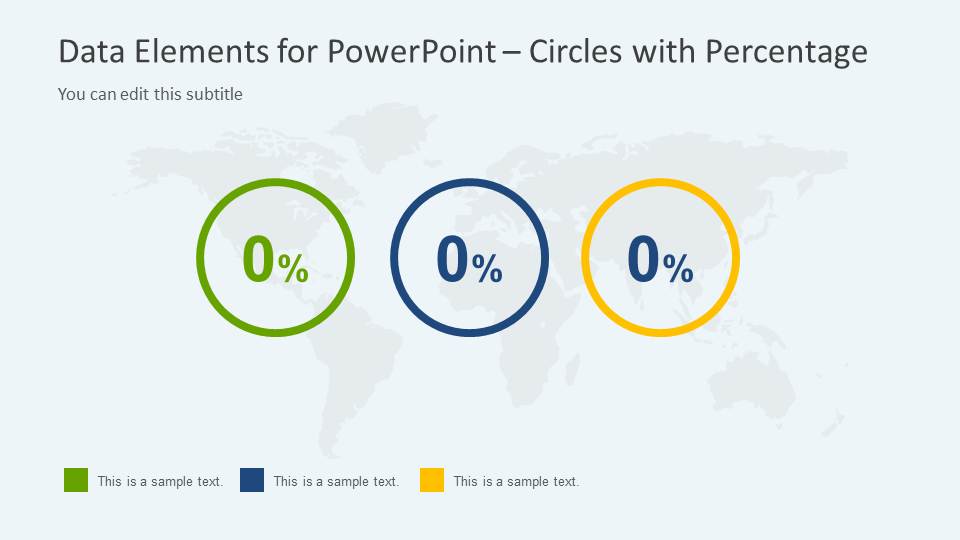
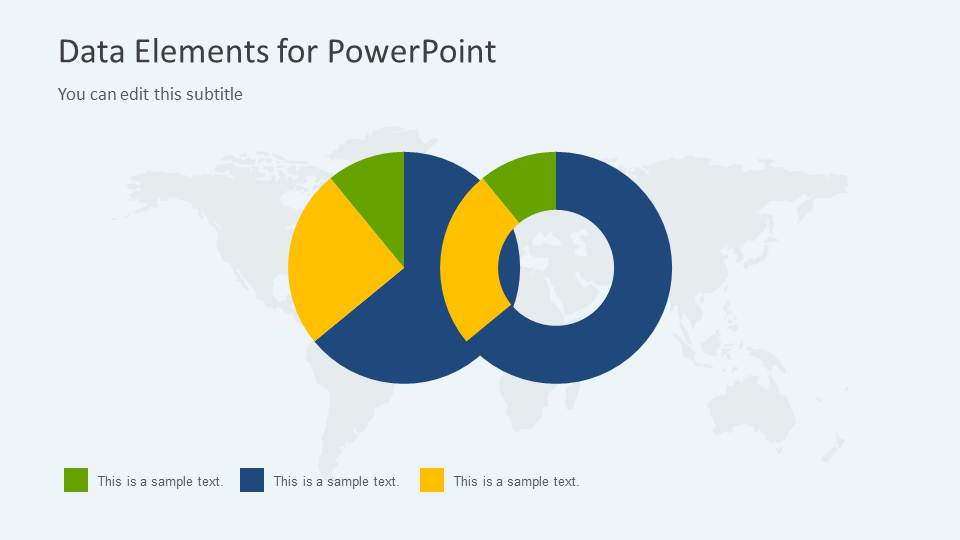
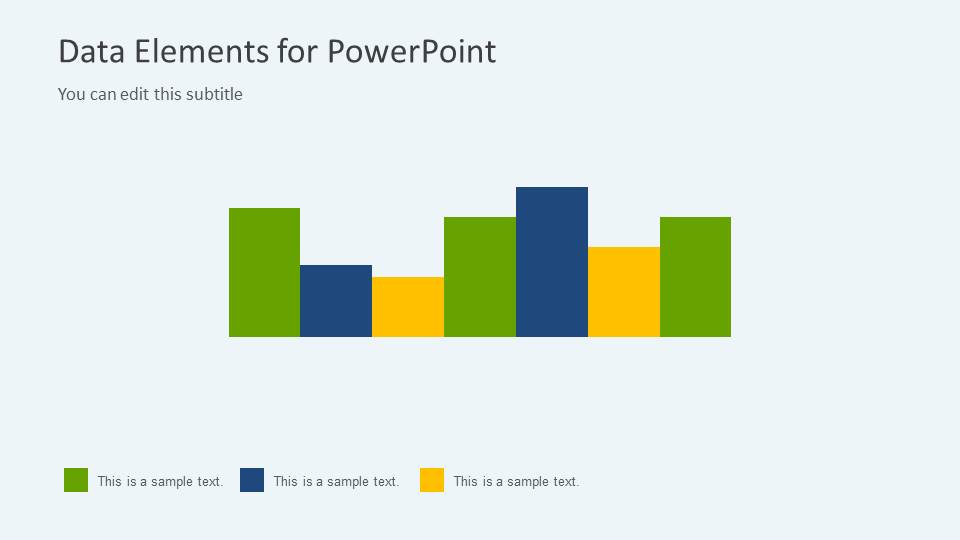
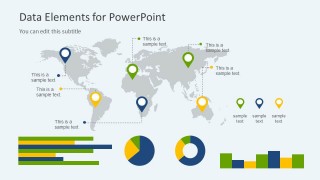
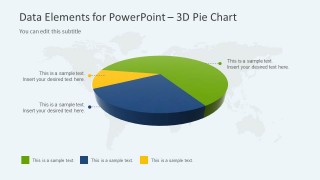
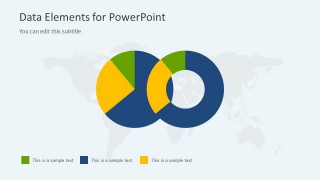
Inside this Data Elements PowerPoint template you can find examples of a bar chart slide, 3D pie chart design, horizontal line chart, a KPI slide design with three key performance indicators in a circle, a 2D donut chart with an overlapping pie chart and a world map design with map makers or map pointers that you can use to pin point any desired location.
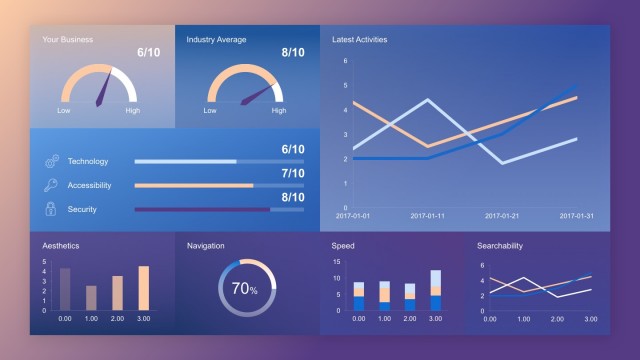
Alternatively you can download dashboard presentation templates and other data chart templates for Microsoft PowerPoint presentations that can help you to present data in a slide.


You must be logged in to download this file.
DOWNLOAD- Category
- Data & Charts
- Rating


 Loading...
- Size
- 16x9
- Item ID
- 6063-01
- Colors
Subscribe today and get immediate
access to download our PowerPoint templates.