Creative Chart Dashboards PowerPoint Template
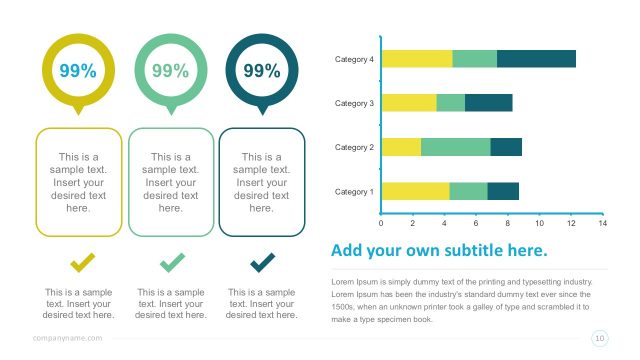
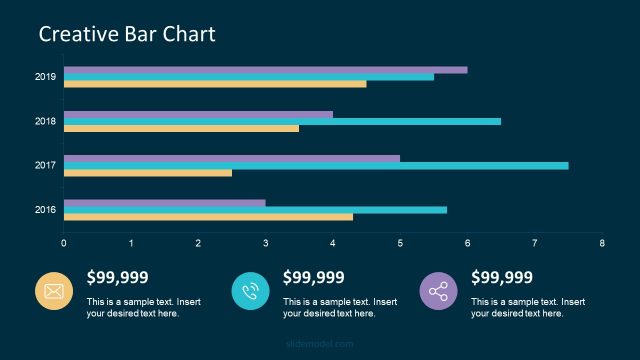
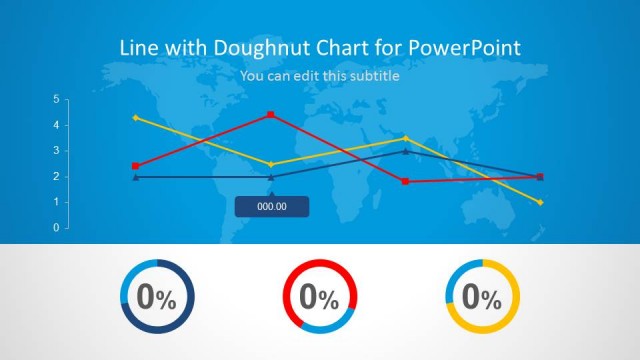
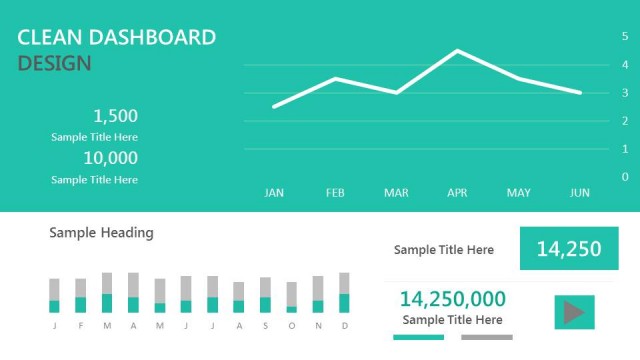
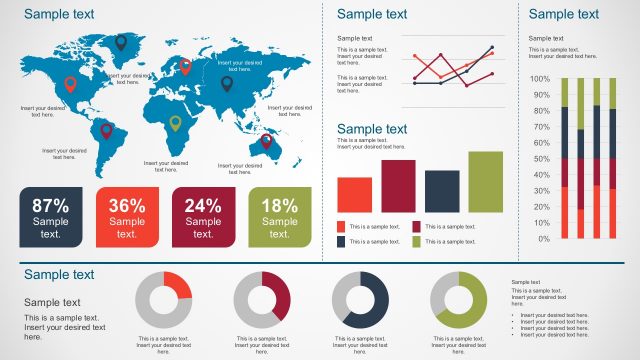
Creative Chart Dashboards PowerPoint Template is a presentation containing a set of screen monitors showing line charts and pie charts with value markers. The initial splash page is created generating the effect that the chart is floating in front of the monitor. Also a world map slide is included with several GPS marker icons, and a couple of donuts charts. The Line chart is editable as a PowerPoint shape. The PowerPoint Pie Chart, and the PowerPoint Donuts Charts are data-driven charts, that means, that their representation can be edited with a table data of the excel integration, without the need to work with shape re-sizing. Even though the charts are data driven, the user can customize colors and 3D effects as every PowerPoint object.
Ideal for quick summary presentations or simple dashboards, the Creative Chart Dashboards PowerPoint Template can be combined with several of our PowerPoint Diagrams for complementing the presentation, or with additional PowerPoint Charts from our catalog.


You must be logged in to download this file.
DOWNLOAD- Category
- Data & Charts
- Rating


 Loading...
- Size
- 16x9
- Item ID
- 6492-01
- Colors
Subscribe today and get immediate
access to download our PowerPoint templates.