3×3 Matrix Performance PowerPoint Template
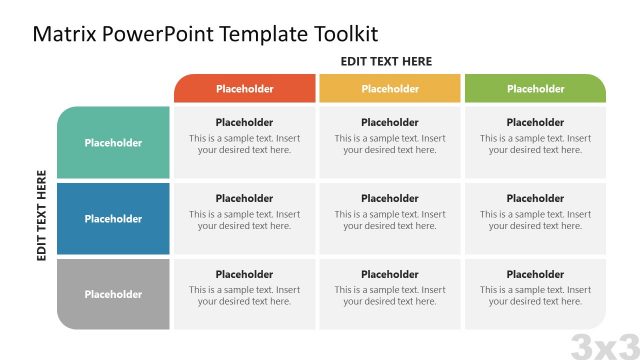
The 3×3 Matrix Performance PowerPoint Template is a modern matrix charter ideal for showcasing variations of KPIs. Key Performance Indicators or KPIs are the metrics that indicate the performance efficiency of a process, project, business, or goal. At every beginning, these performance indicators are defined. Then, their values are tracked continuously to keep up with the work of various departments, individuals, and other components. This Dashboard template provides a framework for professionals to visually indicate the variations and trends of KPIs over time. Managers, Executives, and team leaders can incorporate this easy-to-interpret slide in their professional presentations.
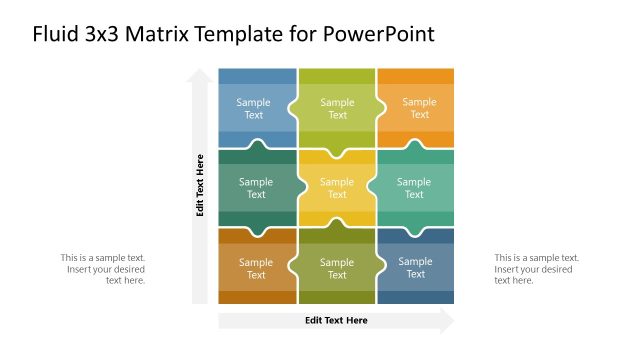
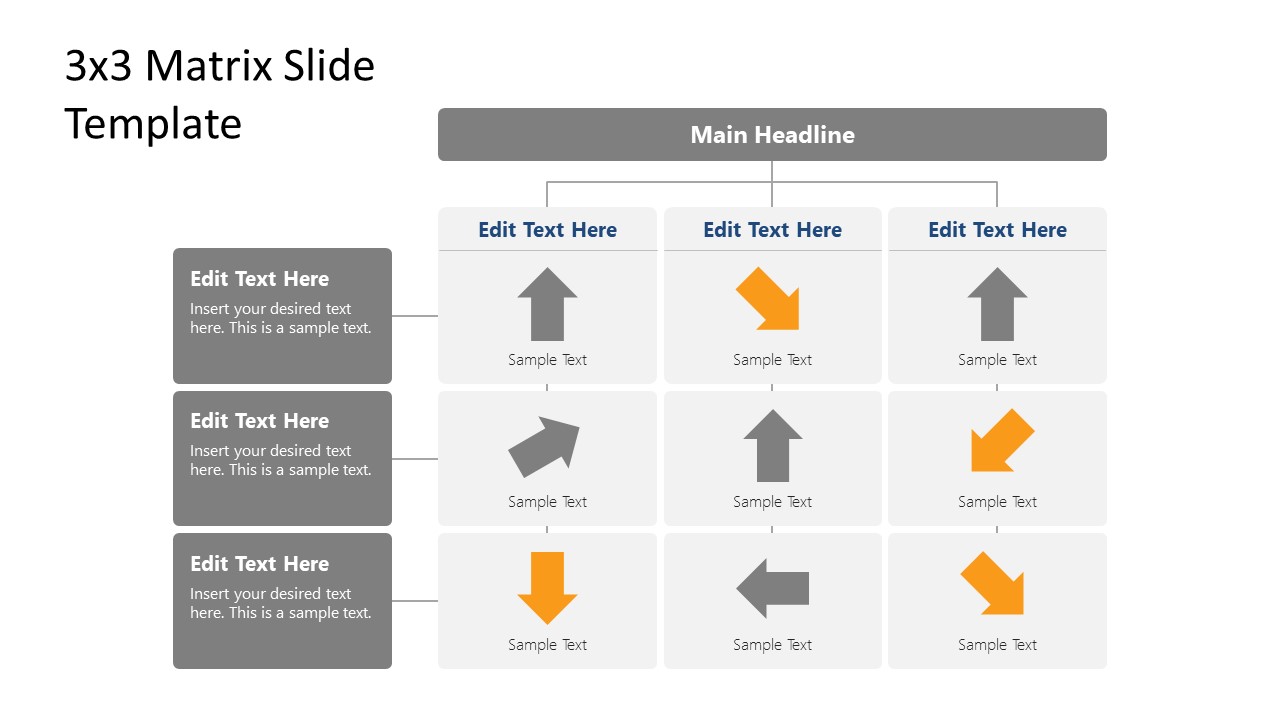
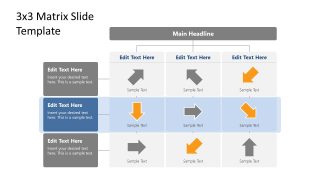
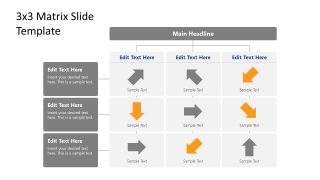
This slide template comprises a 3×3 matrix layout. According to the specific use case, presenters can mention the KPI titles across the rows and columns. The cells of this matrix diagram show bright arrowheads oriented in different directions. These directions depict the trend, or movement of the mentioned indicator, e.g., the forward arrow represents a steady rate, the upwards diagonal shows growth, and the downwards diagonal stands for a declining phase. Thus, by using these arrows, users can easily demonstrate the variable directions of their KPIs. Also, these arrows have small text boxes to mention what is depicted through the representation.
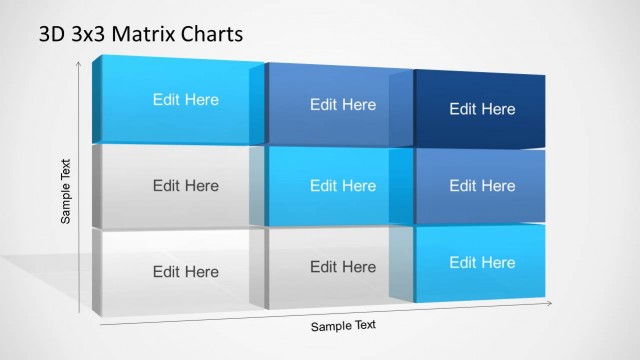
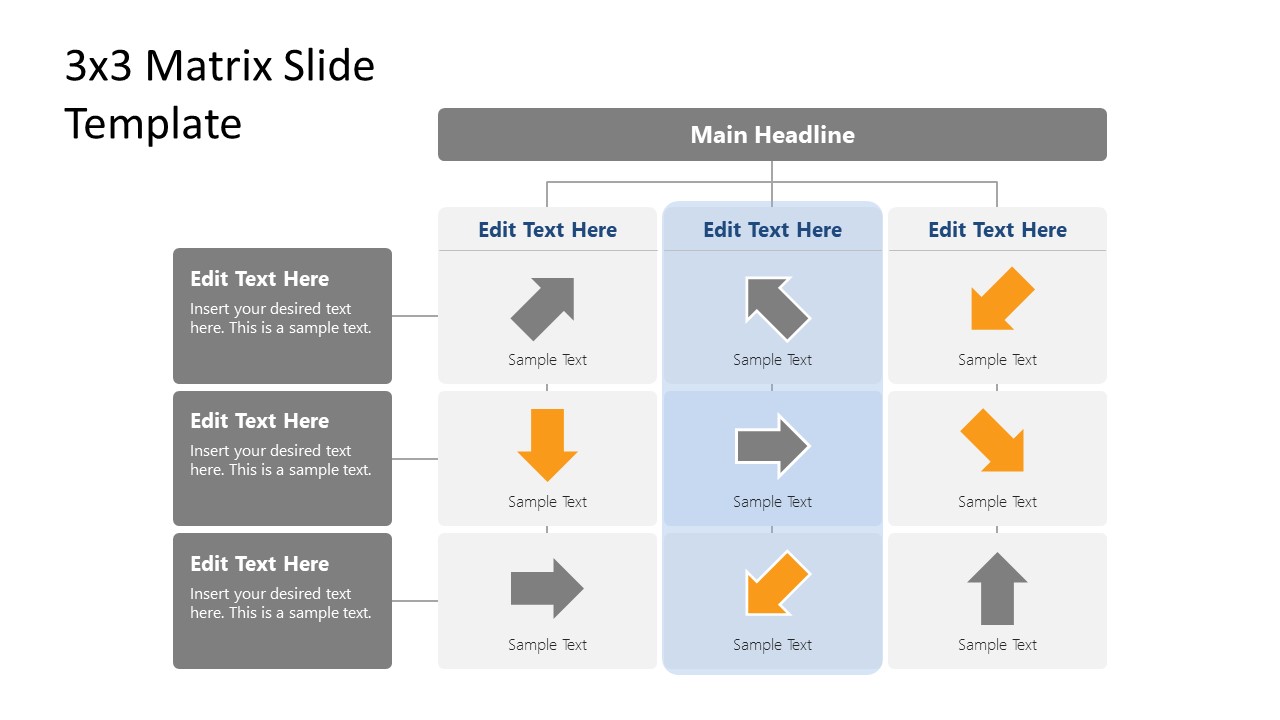
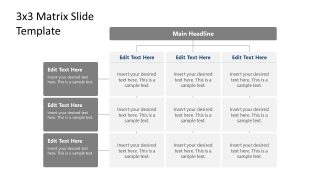
Users are free to change the colors of the arrowhead shapes to highlight or focus on one value. In this diagram, some arrow shapes are grey while some are yellow so that presenters can adjust them accordingly. Similarly, the orientations can also be adjusted by rotating the shapes. After the first slide of this 3×3 Matrix Performance PowerPoint Template, two slides highlight or overlay a colored strip over a row or column. This effect especially helps to discuss a particular KPI variation concerning different situations. For instance, in a business presentation, professionals can show the revenue generation (KPI) over a 3, 6, and 9 months period using this diagram’s three columns and rows.
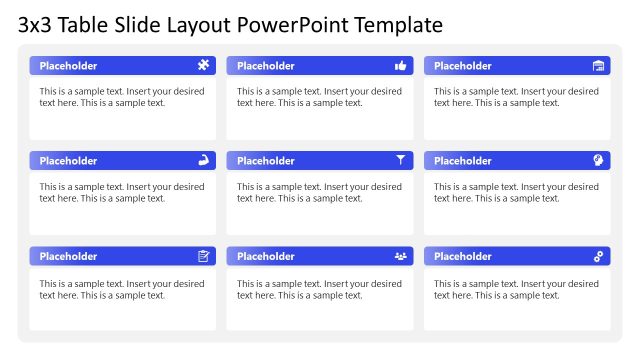
Besides business, Users can use this matrix charter in digital marketing and data analysis presentations to indicate trends and growth. So, download this 3×3 Matrix Performance template for your professional PowerPoint presentations. Alternatively, you can download other 3×3 matrix templates for PowerPoint and Google Slides with 100% editable text placeholders.


You must be logged in to download this file.
DOWNLOAD- Category
- Matrix Charts
- Rating

 Loading...
- Size
- 16x9
- Item ID
- 21484-01
- Colors
Subscribe today and get immediate
access to download our PowerPoint templates.