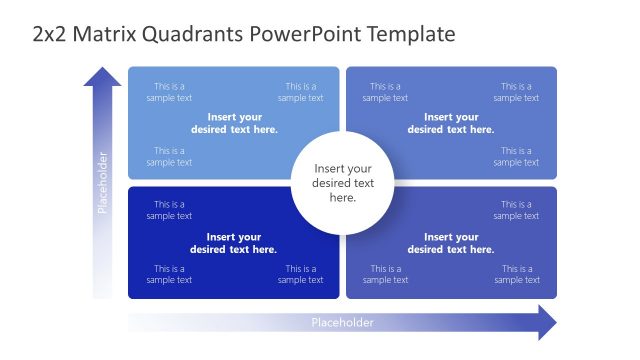
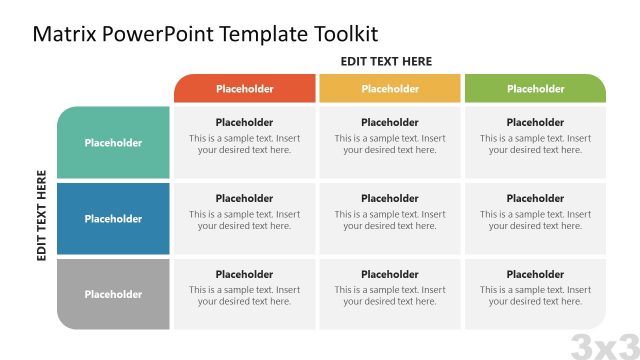
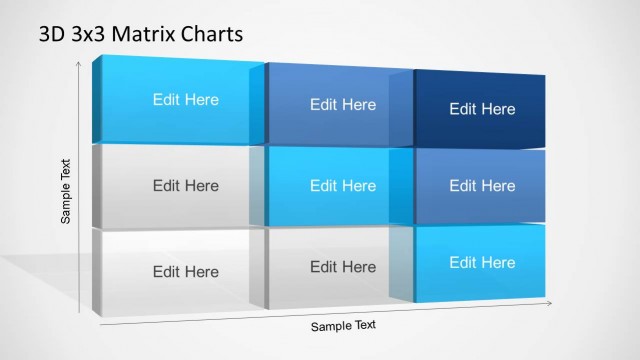
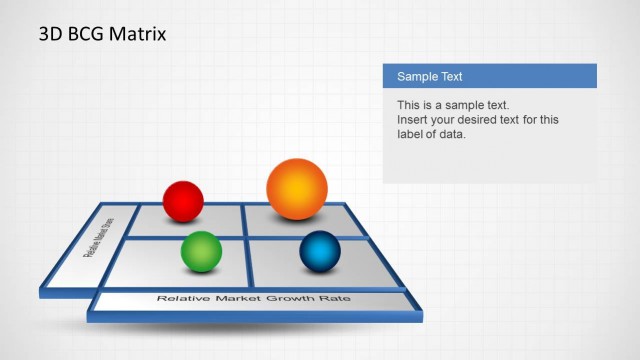
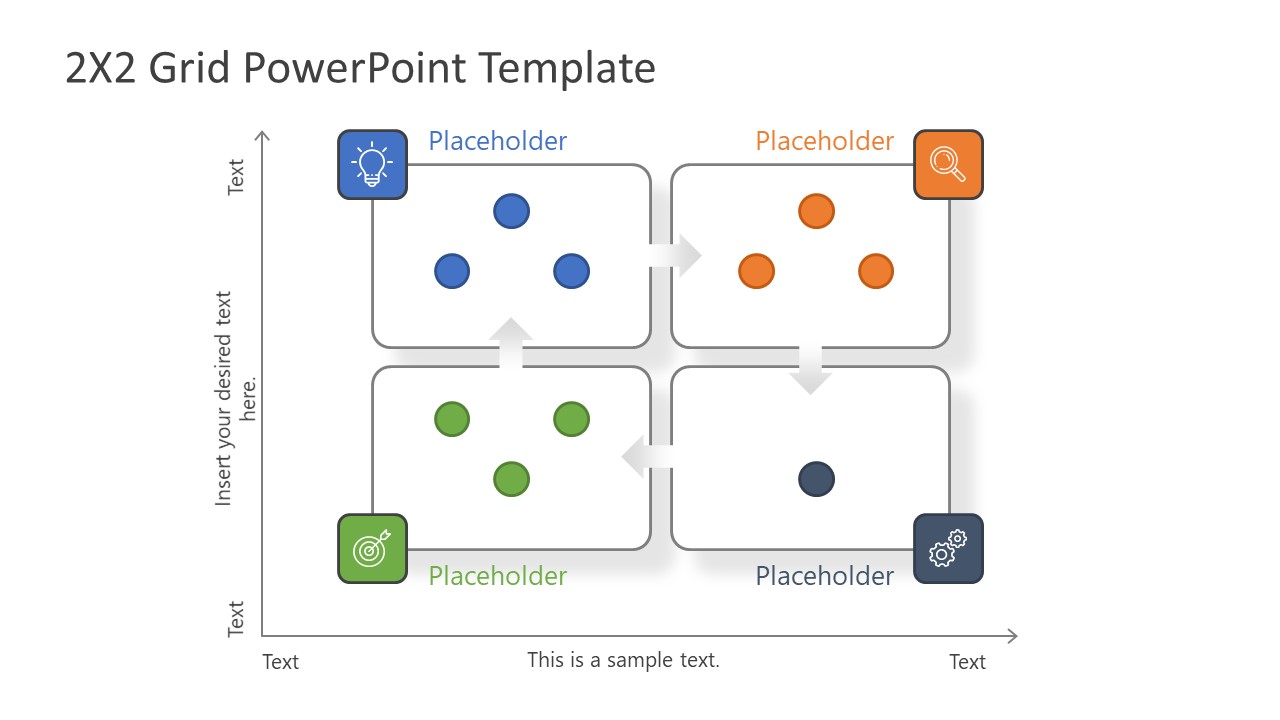
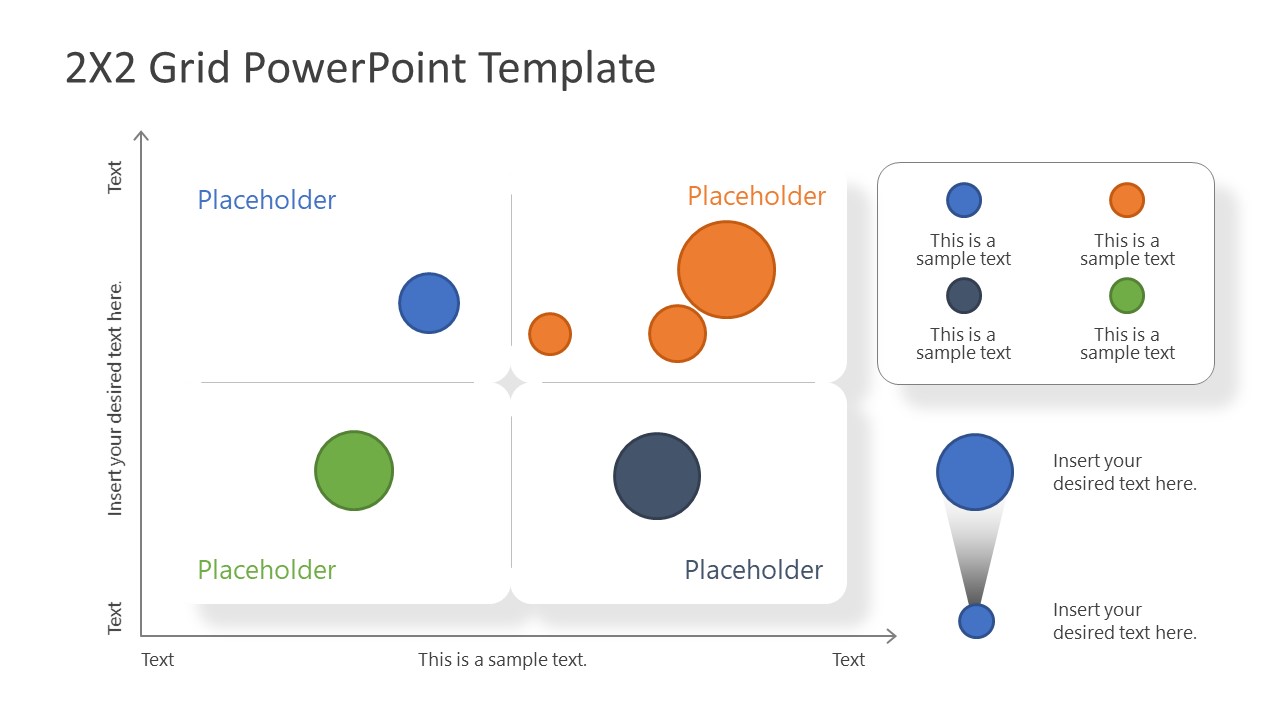
The 2×2 Matrix PowerPoint Template is a simple layout of matrix chart used in many presentations to plot information categorically. These categories then help analyze the data and display relationships between data sets. 2X2 matrix business PowerPoint templates download presents four quadrants with circular shapes representing the valuation of data.
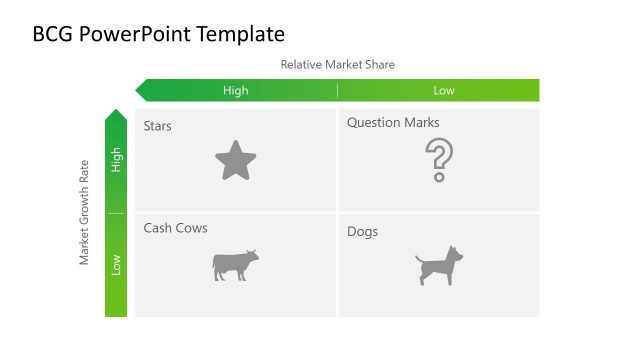
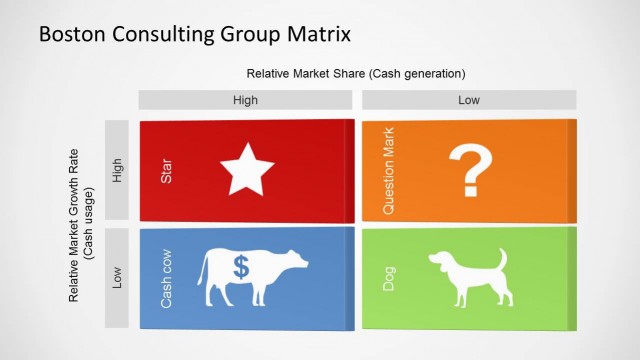
The 2×2 Matrix PowerPoint slides are multipurpose PPT presentation templates and Google Slides Templates. You can use business presentation PowerPoint templates to create a presentation around the analysis of business topics or download it for educational purposes. The PowerPoint templates charts layouts are especially useful for presenting a growth-share matrix, an essential marketing strategy model. The growth-chare or BCG matrix model is used by companies to analyze business units for allocation of budget. Users can download business PowerPoint templates of 2×2 matrix to map business divisions or products across market share and growth dimensions.
The appliance manufacturing company, for example, uses growth-share (BCG matrix) slide presentation templates to classify products into four categories for further analysis. These categories are Cash Cows, Stars, Dogs, and Question Mark. Use circular icons to represent products in each category. You can resize these shapes according to market share or the growth rate of product.
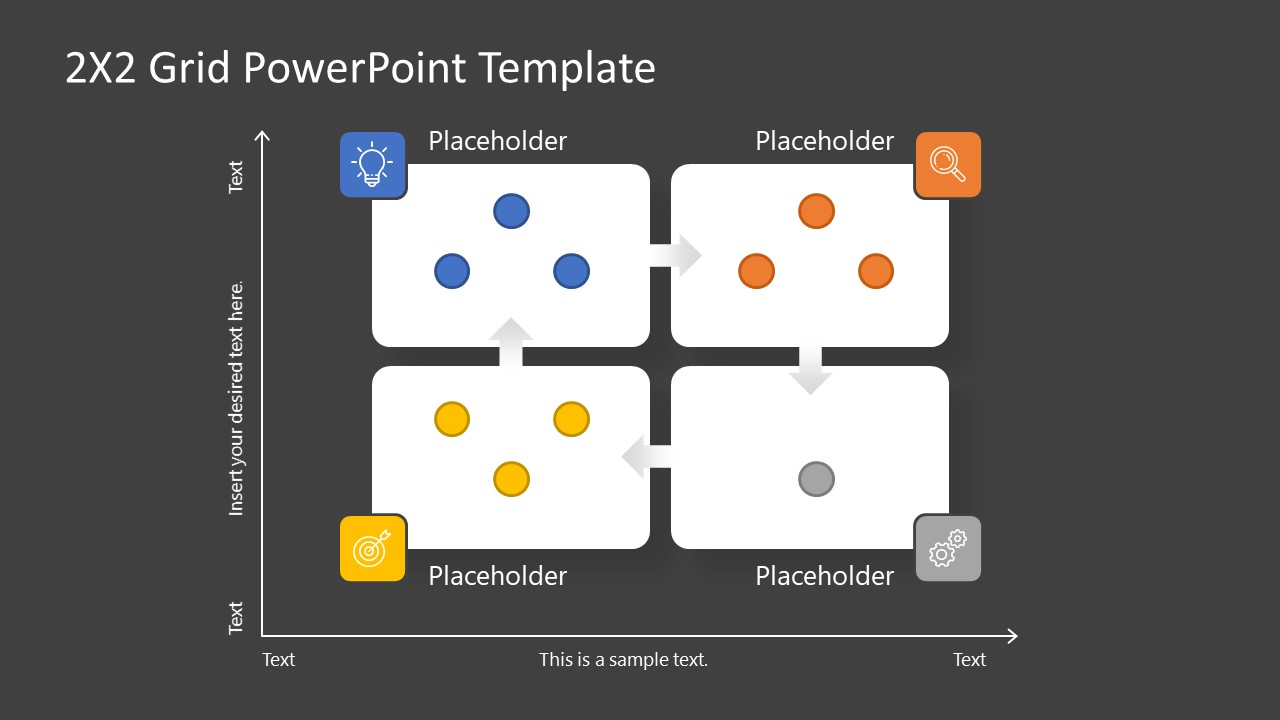
2×2 Matrix PowerPoint Template provides two versions of matrix chart nice PowerPoint themes i.e., clipart icons and color-coding representation. Further to this, the two cool PowerPoint backgrounds option in PowerPoint for users to copy layout according to their presentation theme.
What’s inside this template
Example presentation scenarios
- A product manager can present feature prioritization by placing initiatives in the 2x2 matrix and using the bubble markers to show relative importance or scale.
- A marketing strategist can explain a growth-share analysis by labeling the four quadrants and positioning product lines as colored circles within the grid.
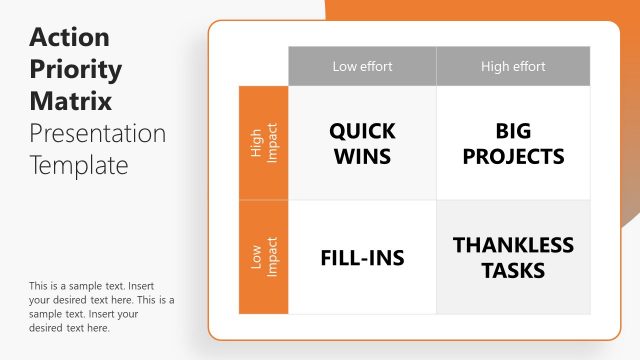
- A consultant can guide an executive workshop by using the impact-effort style matrix to compare opportunities and discuss which quadrant deserves action first.
- An educator can teach matrix-based decision models by using the light and dark versions to show quadrant definitions, axis meanings, and example placements.
Features
- 100% editable presentation template
- Compatible with Microsoft PowerPoint and Google Slides
- 16:9 aspect ratio slides
- Scalable vector shapes, icons and illustrations
- AI-Ready for Microsoft Copilot and Claude
- Instant access and download
Frequently asked questions
Q: How should a presenter explain the matrix without making the slide feel abstract?
A: Start by naming the two axes and defining what high and low mean on each one. Then introduce each quadrant in plain language before placing the colored circles. The bubble positions should support one decision question, such as which initiatives to fund, which products to monitor, or which actions to do first.
Q: Who benefits most from using this 2x2 matrix format?
A: This format works best for presenters who need to compare options across two criteria, such as market growth and share, impact and effort, or risk and value. Strategy teams, product managers, marketers, and educators can use the quadrant labels and circle markers to make categorical analysis easier for an audience to discuss.
Q: Why does the 2x2 quadrant metaphor help communication?
A: The four-quadrant structure turns a comparison into a spatial map, so the audience can see relationships faster than in a list. The colored bubbles show position and relative weight, while the axis arrows explain the logic behind placement. This makes tradeoffs, outliers, and priority zones easier to identify.


2×2 Matrix PowerPoint Template
4-slide presentation template with editable 2x2 matrix diagrams for prioritization and portfolio analysis
The 2x2 Matrix PowerPoint Template is a 4-slide diagram template for plotting items across two axes. It includes light and dark 2x2 matrix layouts, bubble markers, quadrant labels, icon callouts, and side legend panels for business analysts, marketers, and educators using Microsoft PowerPoint or Google Slides.
- Category
- Diagrams
- Rating

 Loading...
- Aspect ratio
- 16:9
- Item ID
- 20861-01
- Colors
 Microsoft PowerPoint
 Microsoft Copilot
 Claude for PowerPoint
Other formats supported
Subscribe today and get immediate
access to download our PowerPoint templates.