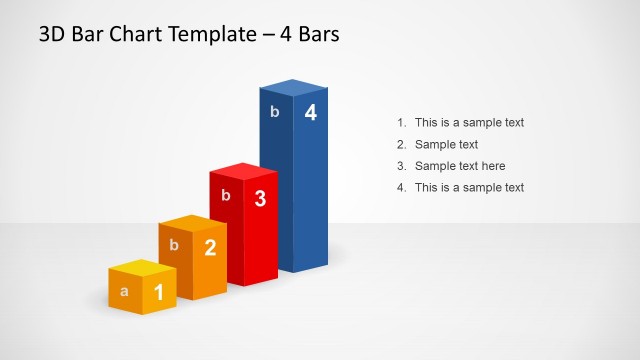
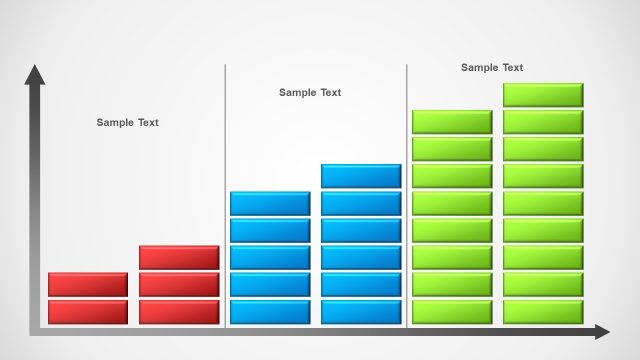
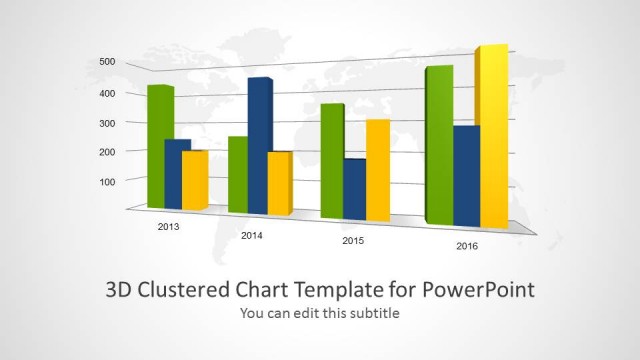
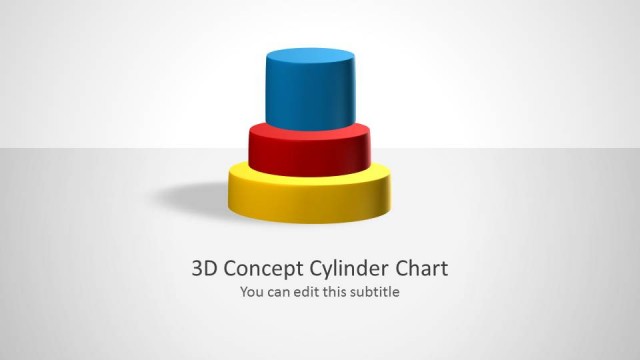
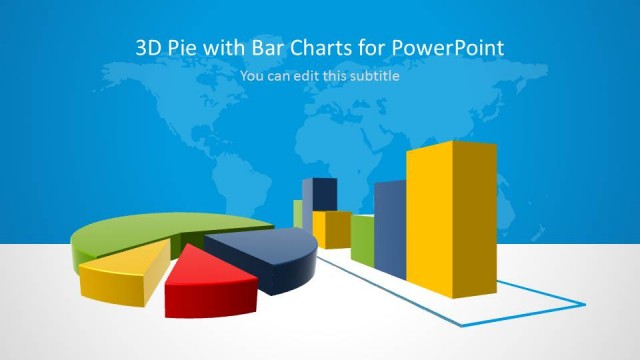
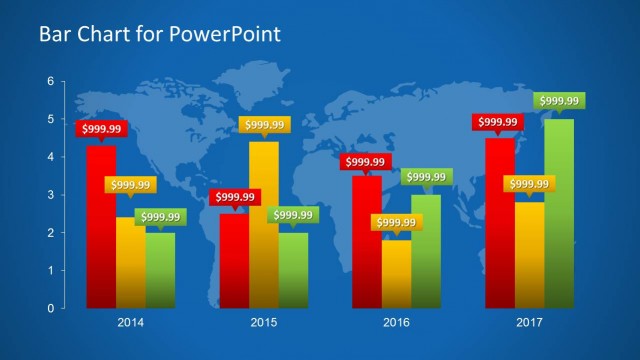
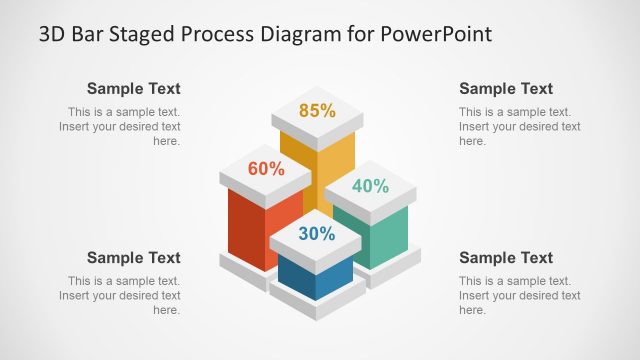
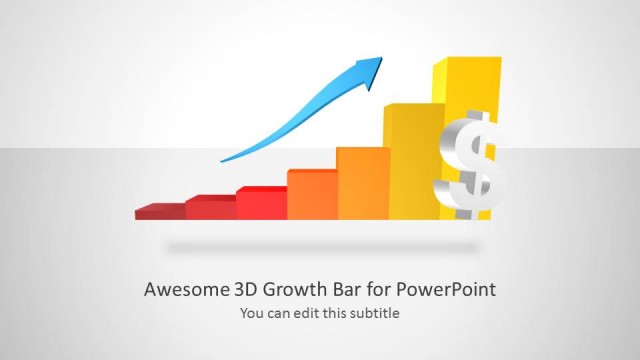
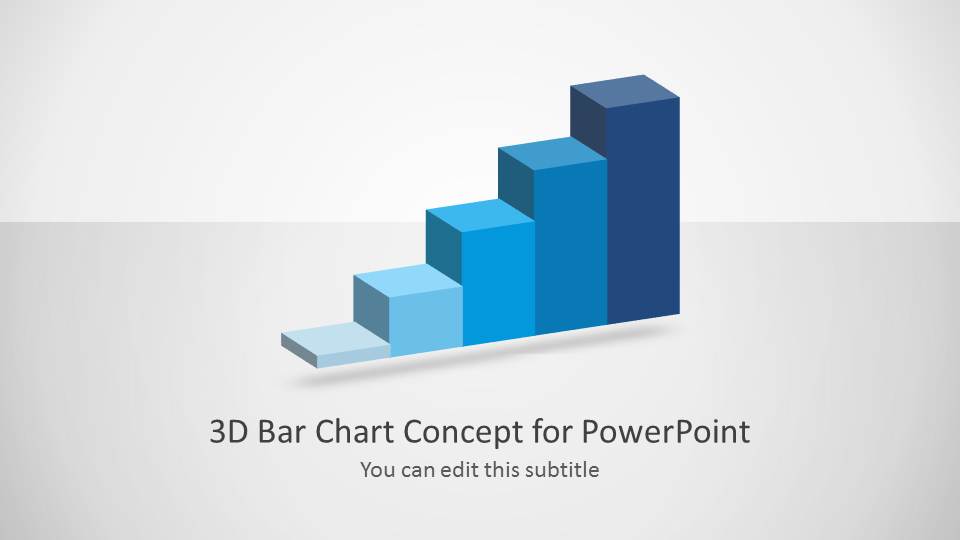
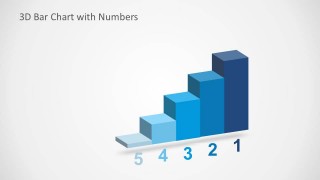
3D Bar Chart Concept for PowerPoint is a PowerPoint presentation design that you can use as a template to copy and paste the 3D bar chart design into your own presentations. Using this 3D bar chart design you can create awesome presentation slides with unique graphics.
This 3D Bar chart design is not data-driven, which means that you cannot generate it from the spreadsheet data or data series, but instead you can customize the height of the bars by changing the height property under Format Shape -> 3D Format -> Bevel section.
What’s inside this template
Example presentation scenarios
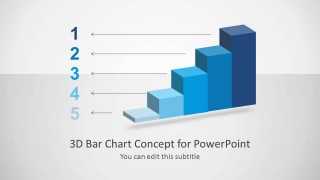
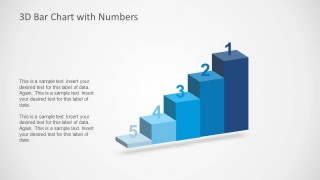
- A business analyst can use the numbered 3D bar chart to explain five ranked drivers behind a performance result to managers.
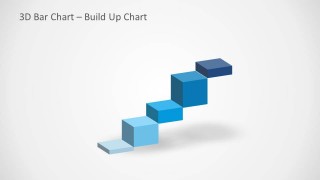
- A finance presenter can use the build up chart to show how separate factors contribute to a total increase in a report.
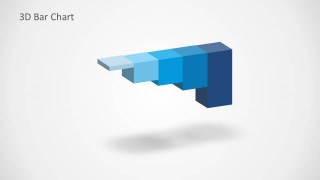
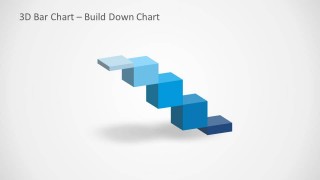
- A strategy consultant can use the build down chart to illustrate margin pressure, cost reduction, or stepwise decline in an executive discussion.
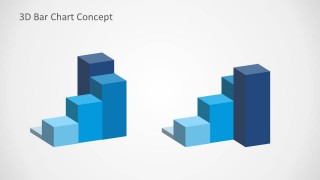
- A sales manager can use the side-by-side bar chart variants to compare two performance views without building a spreadsheet chart.
Features
- 100% editable presentation template
- Compatible with Microsoft PowerPoint and Google Slides
- Scalable vector shapes, icons and illustrations
- AI-Ready for Microsoft Copilot and Claude
- Instant access and download
Frequently asked questions
Q: How should a presenter make the 3D bar chart message clear without overloading the slide?
A: Use the chart as a visual hierarchy tool, not as a full data table. Put the main takeaway in the title, label only the five visible bars or callouts, and reserve body text for a short interpretation. If exact values matter, add small labels near the bars rather than crowding the 3D area.
Q: Who is this template best suited for in a business presentation?
A: It fits presenters who need to explain relative size, ordered priorities, or directional change in a compact visual. Analysts, finance teams, sales managers, and consultants can use the numbered bar chart, side-by-side bar variants, and build up or build down slides to make a metric discussion easier to follow.
Q: Why use a build up or build down 3D bar metaphor instead of a standard bar chart?
A: The 3D blocks create a stair-step metaphor, so the audience sees movement as a sequence rather than a static comparison. The build up slide works well for accumulation or growth, while the build down slide supports reduction, decline, or decomposition. This makes the direction of change immediately visible.


3D Bar Chart Concept for PowerPoint
8-slide PowerPoint presentation template with 3D bar chart and build up/build down waterfall visuals
3D Bar Chart Concept for PowerPoint is an 8-slide presentation template for showing ranked values, growth steps, and waterfall-style movement with editable 3D shape bars. Visible layouts include a title slide, numbered 3D bar chart, build up chart, build down chart, and side-by-side comparison chart for business presenters.


 Loading...
 Microsoft PowerPoint
  Microsoft Copilot
  Claude for PowerPoint
 Other formats supported
Subscribe today and get immediate
access to download our PowerPoint templates.