Slide 1 of 8 from 3D Bar Chart Concept for PowerPoint
3D Chart Design Slide for PowerPoint
3D Bar Chart Concept for PowerPoint
- Diagram
- Other
- Context Slide
- 16:9
- 100% Editable
The 3D Bar Chart Concept slide from the 3D Bar Chart Concept for PowerPoint template provides a clear visual introduction to data trends and growth metrics. Designed for business presentations, this slide uses editable shapes and vector icons to emphasize performance and project milestones effectively within a corporate presentation or pitch deck template.
What’s on This Slide
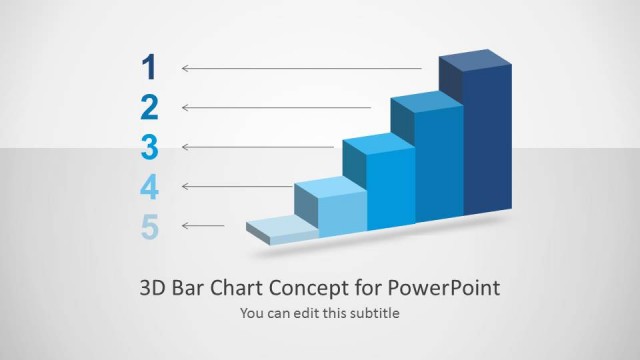
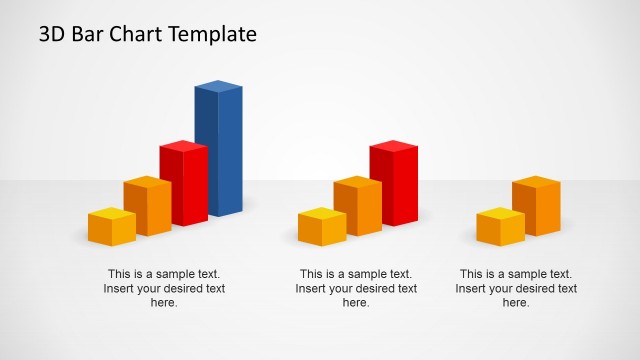
The slide features a 3D bar chart positioned centrally, displaying four ascending bars in varying shades of blue. The bars are stacked from left to right, with the tallest bar on the right. A title is located at the bottom center, while a subtitle placeholder is directly below it. The background is light gray, providing contrast to the blue bars. There are no additional images or icons present, and the overall composition emphasizes the chart's growth representation. The visual hierarchy is clear, with the title being the most prominent element.
How to Use It
This layout serves as an introductory slide for presenting data trends or growth metrics. It is suitable for business contexts where visualizing ranked values or progress is necessary. This slide fits at the beginning of a presentation, establishing the theme before diving into detailed data analysis. It can be used in reports, pitches, or meetings to highlight performance metrics or project milestones. The clear visual structure aids in conveying information effectively to the audience.
Text Placeholders & Capacity
Keep your copy within these limits so it fits without resizing. Title slots can hold about 5-7 words each.
| Placeholder | Count | Max characters (approx.) |
|---|---|---|
| Slide title | 1 | 30 |
| Subtitle | 1 | 30 |
Slide Keywords
Download unlimited PowerPoint templates, charts and graphics for your presentations with our annual plan.
DOWNLOADReturn to 3D Bar Chart Concept for PowerPoint.