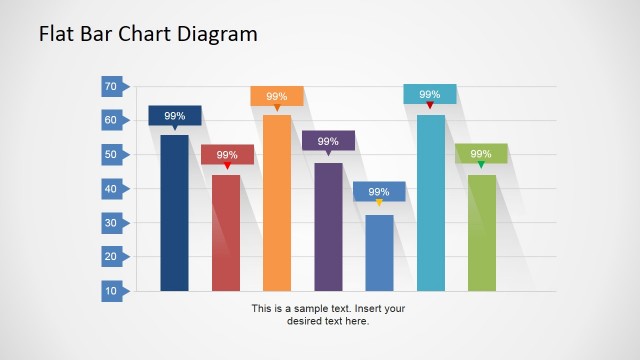
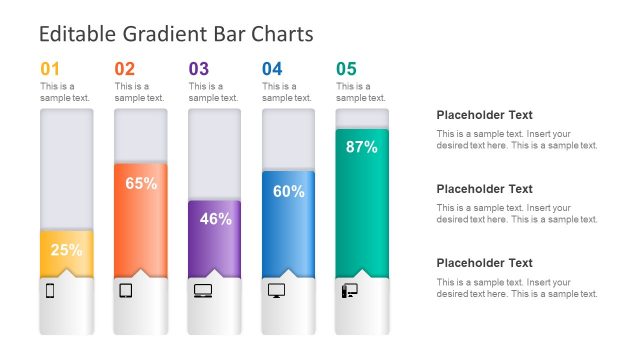
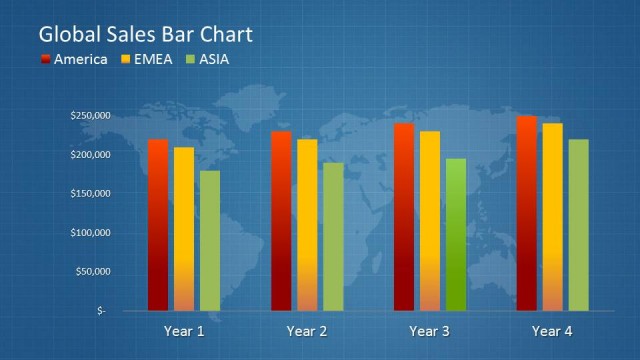
Concept Bar Chart template for presentations in PowerPoint is a chart template design created with blocks. The first chart design simulates a digital equalizer. This creative design is constructed using PowerPoint Shapes, allowing the user to fully customize properties as size, 3D effect, shadows, colors and gradients. The presenter can picture data elements using the blocks as Bar Charts and describing in the same chart different layers. The Cartesian Axis are created with flat grey arrows , that can be edited to fill the size required for the data points.
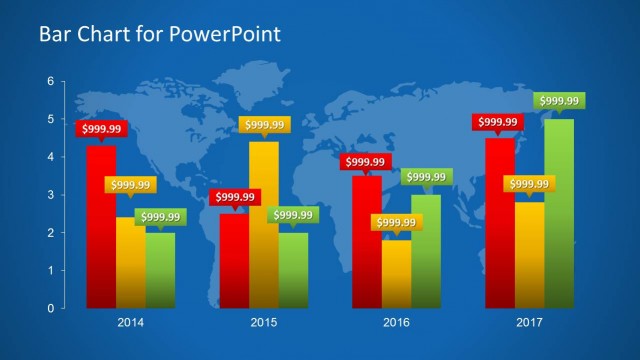
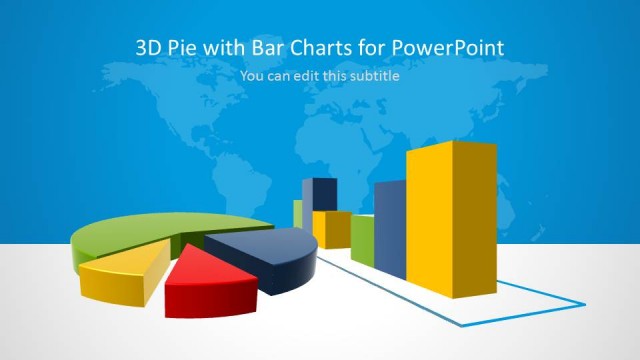
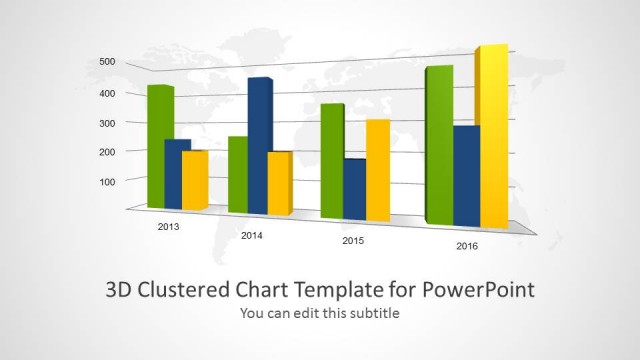
The presentation also contains 3D Bar Charts for regular PowerPoint representations. Use this awesome PowerPoint Chart for your financial or marketing presentation and transmit your message with great designs that appeal to global audiences.
Combine this Bar Chart Templates with different Pie Charts or Line Charts from our PowerPoint Charts catalog, and build professional Dashboards for your executives.
What’s inside this template
Example presentation scenarios
- A marketing manager can present channel performance by replacing the equalizer-style block columns with campaign values and using the labels to name each channel.
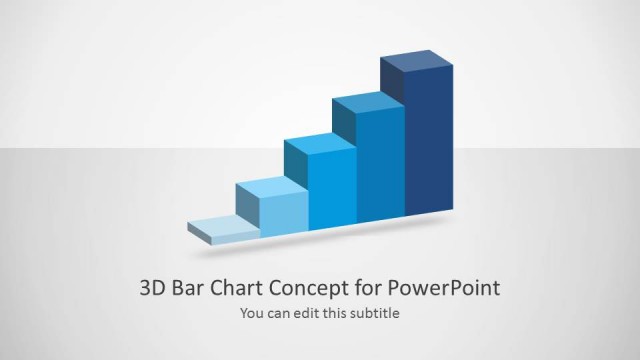
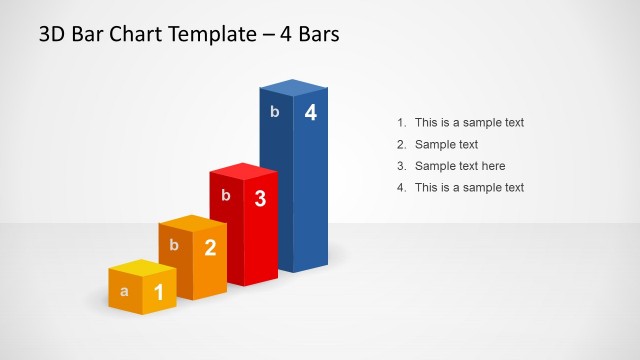
- A finance analyst can compare monthly revenue or cost categories with the 3D ascending bar chart and use the side text box to explain the main takeaway.
- An operations leader can show capacity, utilization, or service levels with the dense segmented block chart, where each stack represents a comparable unit or threshold.
- A consultant can highlight a key outlier in a client benchmark using the green 3D bar chart with the single red column as the focal point.
Features
- 100% editable presentation template
- Compatible with Microsoft PowerPoint and Google Slides
- 16:9 aspect ratio slides
- Scalable vector shapes, icons and illustrations
- AI-Ready for Microsoft Copilot and Claude
- Instant access and download
Frequently asked questions
Q: How should a presenter make the message clear with these bar chart concepts?
A: Start by deciding whether the audience needs ranking, grouping, or an outlier callout. Use the equalizer block slides for category levels, the ascending 3D chart for growth or progression, and the red highlighted column when one value needs attention. Keep the labels short and use the side text box for the decision or interpretation, not raw detail.
Q: Who is this template best suited for?
A: This template fits presenters who need to report simple comparisons in a visual way, such as analysts, managers, and consultants. It is best for marketing results, finance comparisons, operations levels, or benchmark summaries where the exact visual difference between bars matters more than a full dashboard or statistical model.
Q: Why use equalizer blocks and 3D bars instead of plain columns?
A: The equalizer metaphor makes levels feel measurable and easy to scan, especially for capacity, performance, or intensity. The 3D bars add visual weight to ranked values, while the highlighted red column creates an immediate exception signal. These choices help the presenter guide attention before discussing the supporting details.


Concept Bar Chart Template for PowerPoint
7-slide bar chart presentation template with equalizer blocks, 3D axes, and comparison charts
Concept Bar Chart Template for PowerPoint is a 7-slide chart template for presenting quantitative comparisons with block-style equalizer bars, segmented column charts, 3D ascending bar charts, and highlighted column charts. It is designed for business, marketing, finance, and performance reporting in Microsoft PowerPoint and Google Slides.
- Category
- Data & Charts
- Rating


 Loading...
- Aspect ratio
- 16:9, 4:3
- Item ID
- 39-01
- Colors
 Microsoft PowerPoint
 Microsoft Copilot
 Claude for PowerPoint
Other formats supported
Subscribe today and get immediate
access to download our PowerPoint templates.