Slide 8 of 8 from 3D Bar Chart Concept for PowerPoint
3D Build Down Chart Slide Design for PowerPoint
3D Bar Chart - Build Down Chart for Presentations
- Diagram
- Other
- Process Slide
- 16:9
- 100% Editable
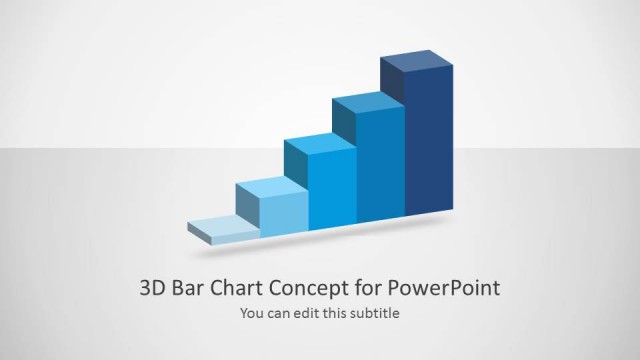
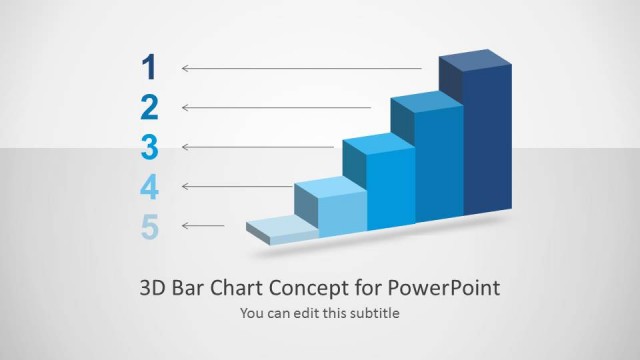
The 3D Bar Chart - Build Down Chart slide from the 3D Bar Chart Concept for PowerPoint template offers a clear visual tool for illustrating decreasing trends in financial reports, project updates, or performance analysis. This slide layout uses editable shapes and vector icons to create a descending 3D bar chart, enhancing the communication of downward processes within business presentations or pitch deck templates.
What’s on This Slide
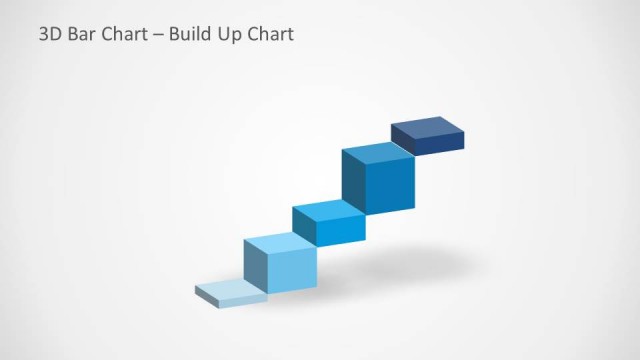
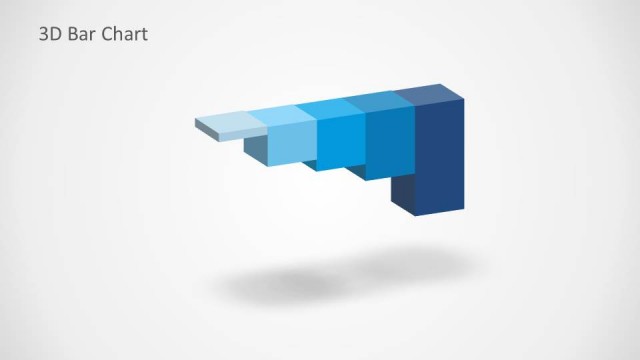
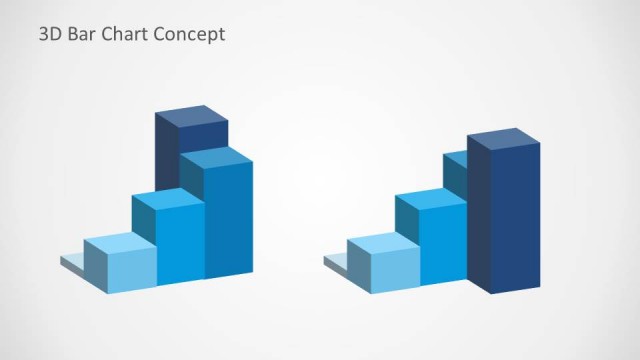
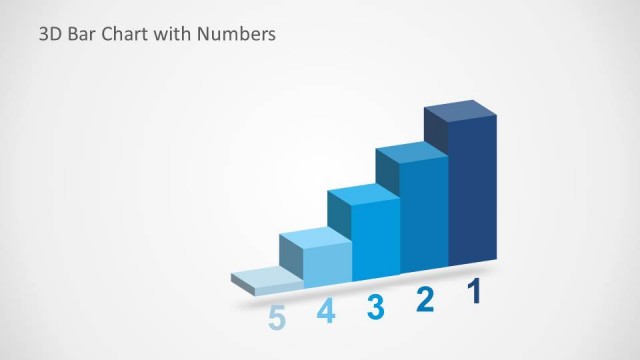
The slide features a 3D bar chart arranged in a descending format, showcasing five distinct blocks. These blocks are staggered, creating a visual effect of building down. The blocks vary in shades of blue, transitioning from light to dark, enhancing the depth perception. A title placeholder is positioned at the top left, with the text aligned left. The background is a light gray, providing contrast to the blue blocks. The overall composition emphasizes the 3D effect, with shadows adding to the visual hierarchy.
How to Use It
This layout serves as a build down chart, ideal for illustrating decreasing values or steps in a process. It fits well in a presentation sequence after presenting growth or increase data. Suitable for business scenarios such as financial reports, project progress updates, or performance analysis, this layout effectively communicates a downward trend. It can be used individually to highlight specific data points or trends in various contexts, making it versatile for different presentations.
Text Placeholders & Capacity
Keep your copy within these limits so it fits without resizing. Title slot can hold about 5-7 words comfortably.
| Placeholder | Count | Max characters (approx.) |
|---|---|---|
| Slide title | 1 | 30 |
Slide Keywords
Download unlimited PowerPoint templates, charts and graphics for your presentations with our annual plan.
DOWNLOADReturn to 3D Bar Chart Concept for PowerPoint.