Slide 5 of 8 from 3D Bar Chart Concept for PowerPoint
6012-3d-bar-chart-concept-wide-5
3D Bar Chart Concept for Presentations
- Diagram
- Comparison Split
- Evaluation Slide
- 16:9
- 100% Editable
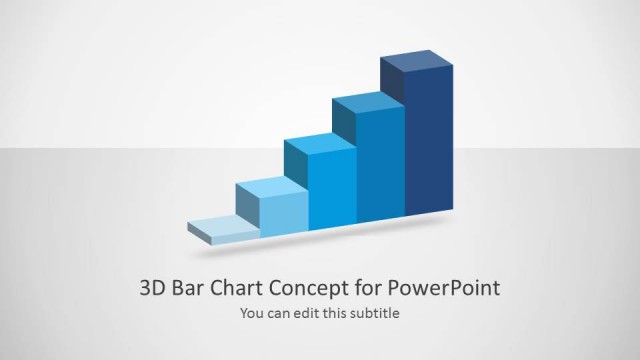
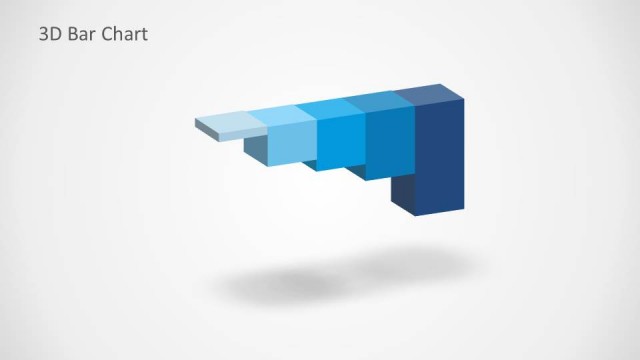
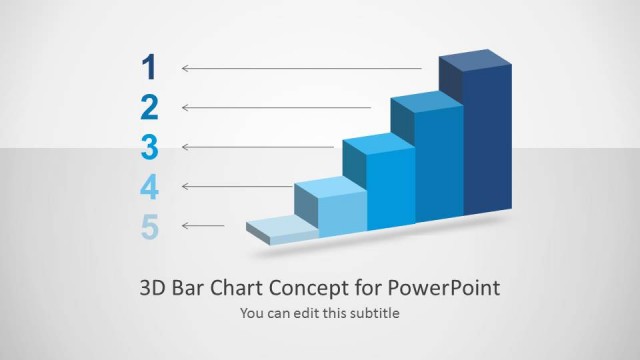
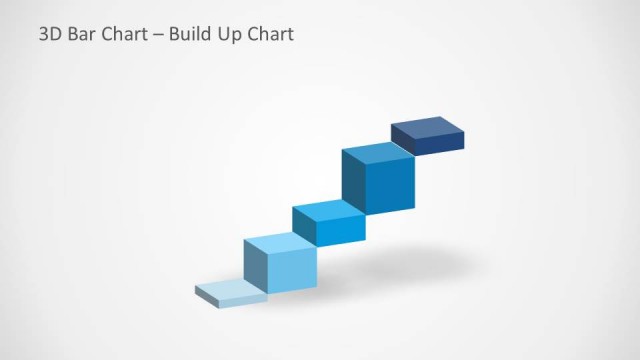
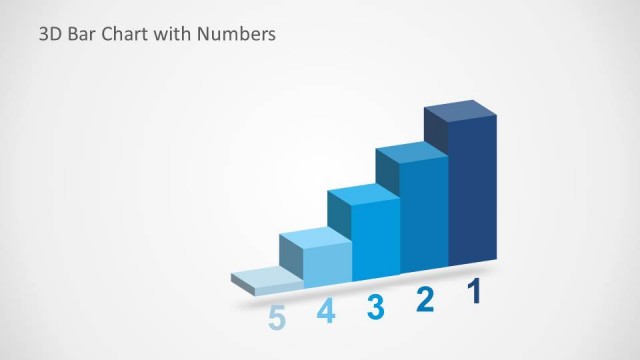
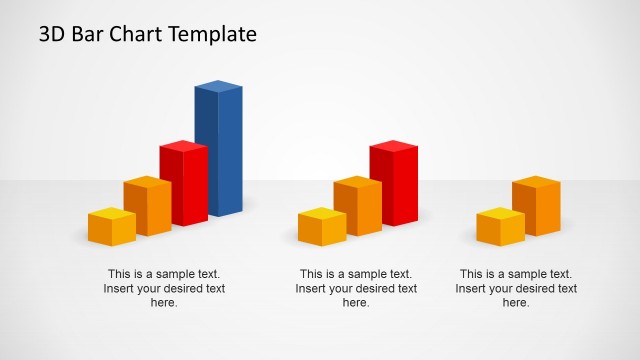
The 3D Bar Chart Concept slide from the 3D Bar Chart Concept for PowerPoint template offers a clear visual comparison using two side-by-side 3D bar charts. This layout is designed for business presentations that require detailed financial analysis or performance metric evaluations. It integrates well with slide decks focused on data comparison, utilizing editable shapes and vector icons to enhance clarity without additional text distractions.
What’s on This Slide
The layout features two sets of 3D bar charts positioned side by side. Each chart consists of three bars of varying heights, with the left chart displaying a build-up style and the right chart showing a build-down style. The bars are colored in shades of blue, transitioning from light to dark. The title is placed at the top left, aligned to the left, while the charts occupy the center and right sections of the slide. There are no text placeholders for additional content, emphasizing the visual elements.
How to Use It
This layout serves as a comparative analysis between two 3D bar charts, ideal for illustrating growth or decline in data. It fits well in a presentation sequence following an introduction to data trends. Business scenarios include performance reviews, financial forecasts, or project progress comparisons. It effectively highlights differences in data representation, making it suitable for analytical discussions.
Text Placeholders & Capacity
Keep your copy within these limits so it fits without resizing. The title slot allows for a concise title of about 5 words.
| Placeholder | Count | Max characters (approx.) |
|---|---|---|
| Slide title | 1 | 20 |
Slide Keywords
Download unlimited PowerPoint templates, charts and graphics for your presentations with our annual plan.
DOWNLOADReturn to 3D Bar Chart Concept for PowerPoint.