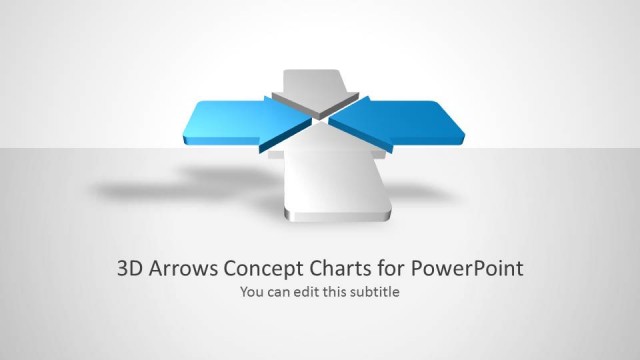
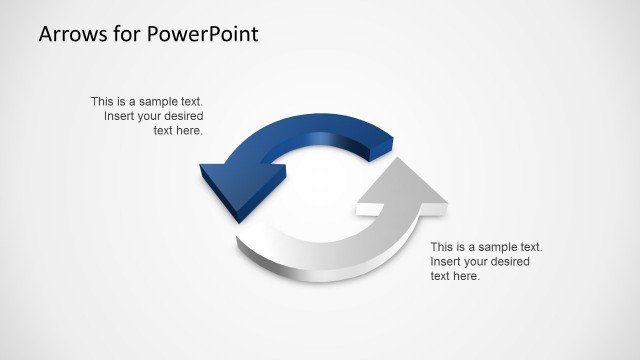
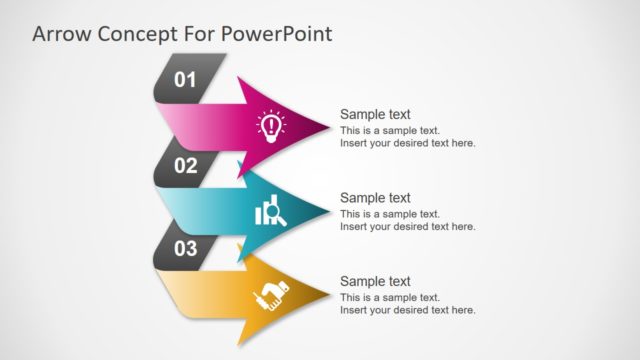
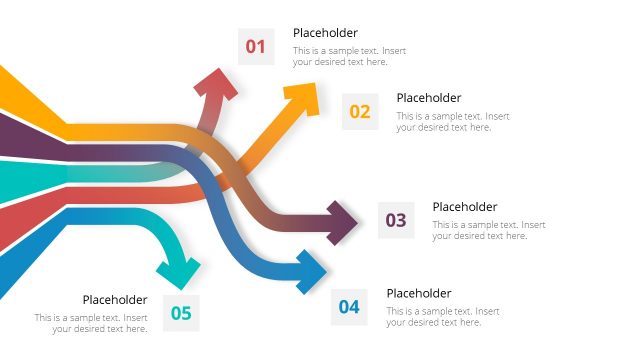
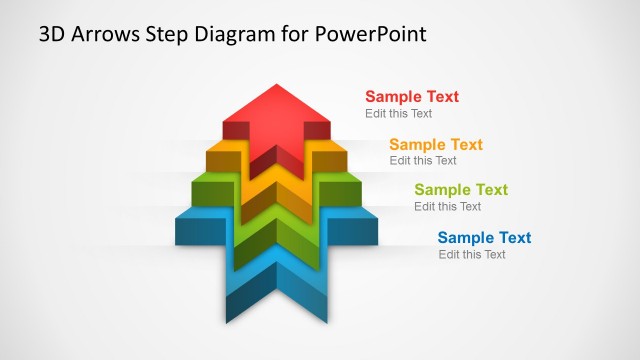
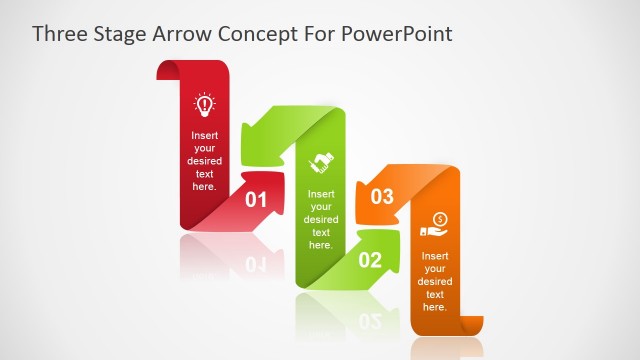
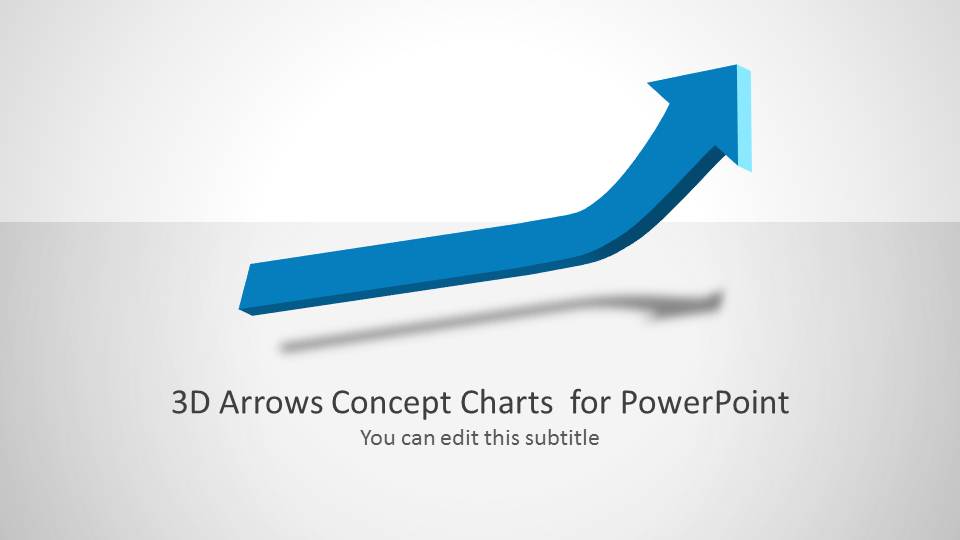
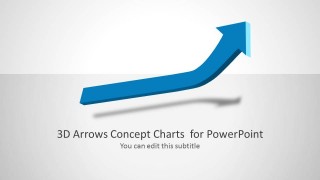
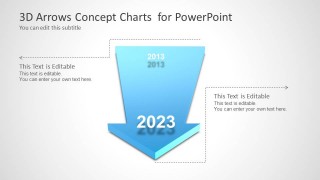
3D Arrows Concept Charts for PowerPoint includes different slide designs with 3D arrows. You can use the arrows concept design to prepare awesome presentations with professional blue styles.
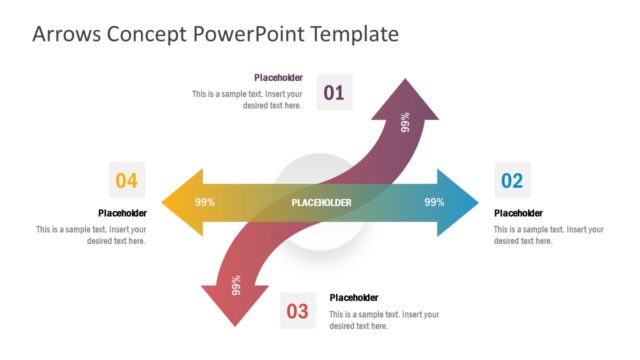
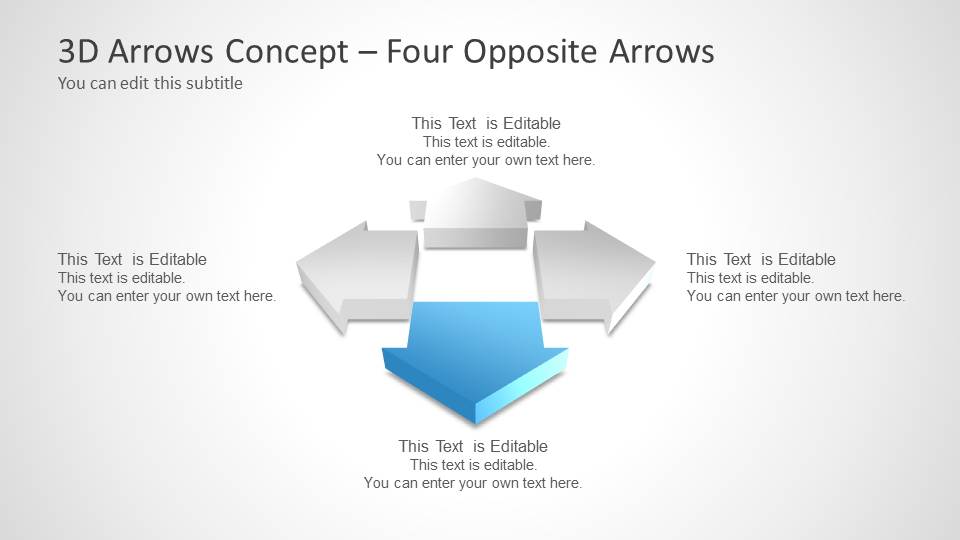
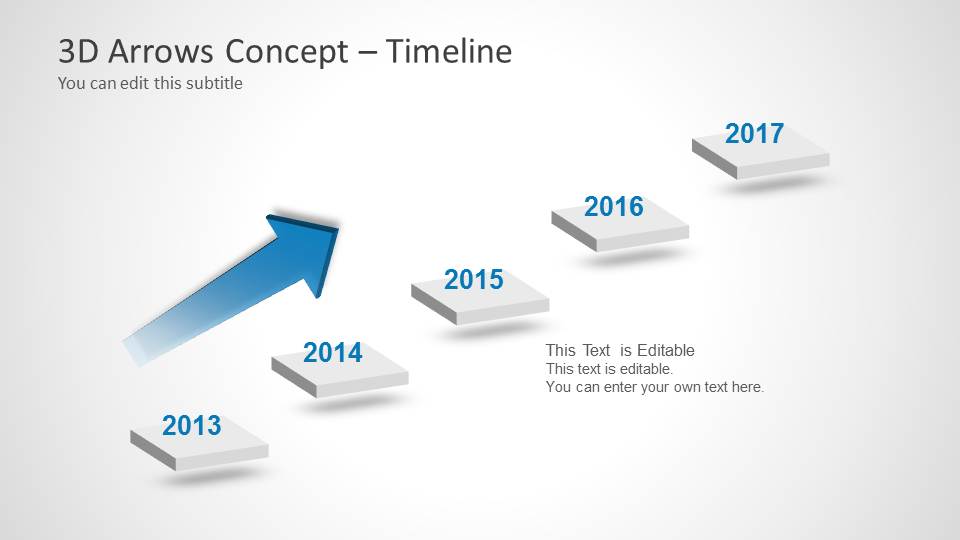
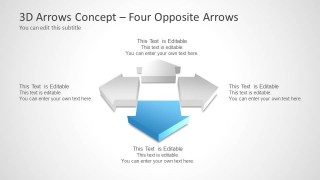
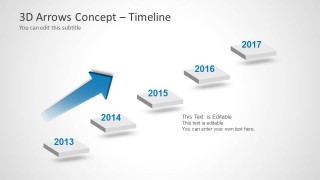
Inside this presentation you can find different arrows (straight and curved arrows) slides to make timelines in PowerPoint or the four opposite arrows to make a comparison of four concepts. Alternatively you can download other 3D graphics for PowerPoint and 3D arrows to decorate your PowerPoint presentations.
What’s inside this template
Example presentation scenarios
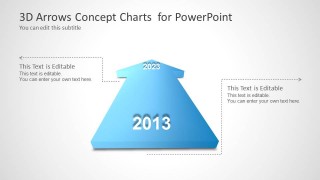
- A project manager can present a milestone update by replacing the year labels in the timeline layout and using the diagonal arrow to show forward movement.
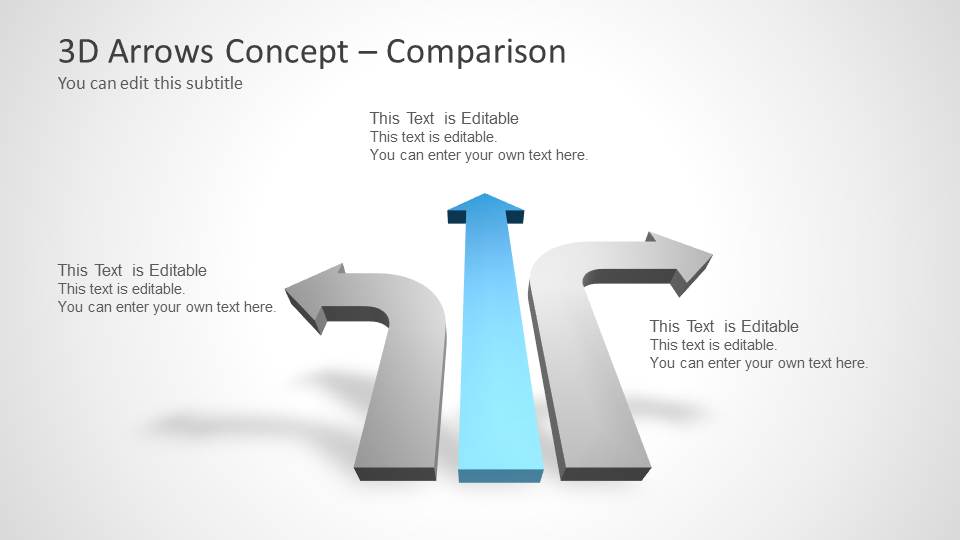
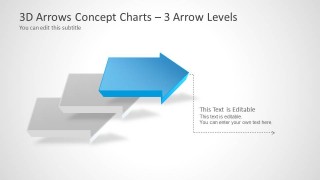
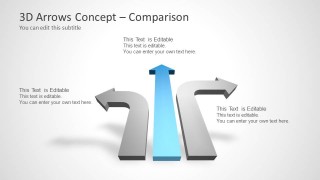
- A consultant can compare strategic alternatives with the four opposite arrows or three-arrow comparison slide, assigning each direction to a competing option or decision path.
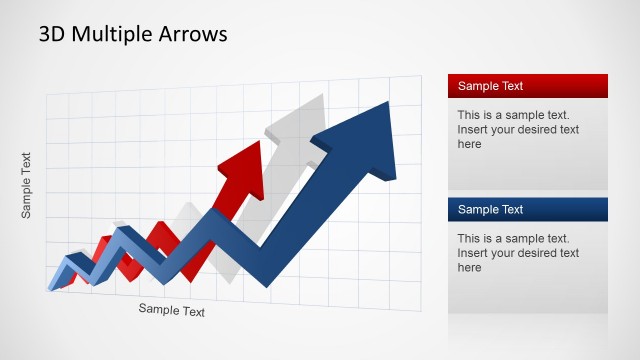
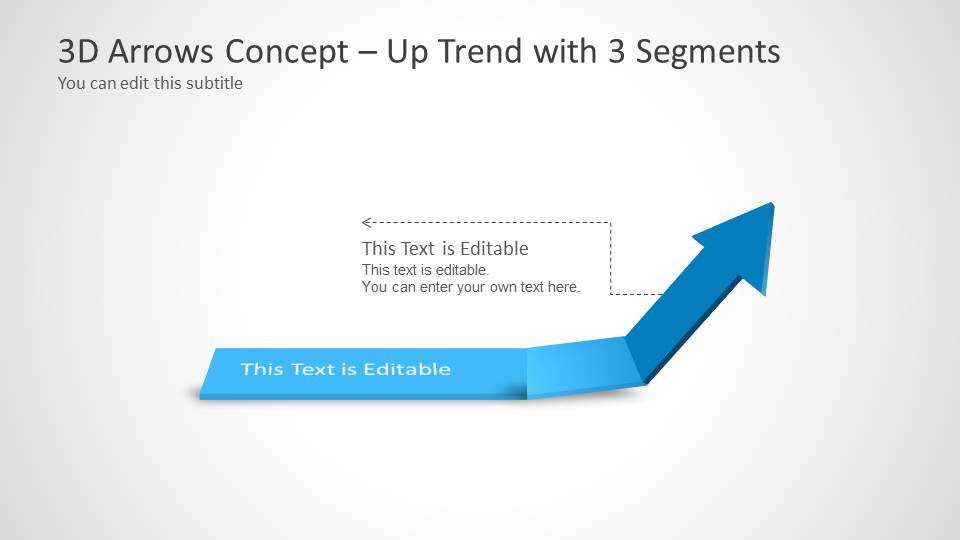
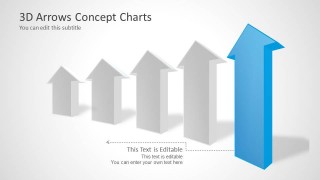
- A sales leader can explain pipeline momentum with the up trend with 3 segments slide, using the segmented arrow to move from current traction to a target outcome.
- A business analyst can explain increasing or decreasing performance by choosing the upward or downward arrow concept and adding short callouts beside the main shape.
Features
- 100% editable presentation template
- Compatible with Microsoft PowerPoint and Google Slides
- Scalable vector shapes, icons and illustrations
- AI-Ready for Microsoft Copilot and Claude
- Instant access and download
Frequently asked questions
Q: How should a presenter use the arrows without making the message feel too abstract?
A: Assign each arrow to a clear business meaning before adding text. For example, use the up trend slide for growth, the downward arrow for reduction or delivery, and the opposite arrows for conflicting options. Keep each callout short, because the 3D shape already communicates direction and should not compete with long paragraphs.
Q: Who is this template best suited for in a business presentation?
A: This template fits presenters who need to explain movement, sequence, or contrast rather than detailed numbers. Consultants, project managers, sales leaders, and analysts can use the timeline, four opposite arrows, and comparison layouts to frame strategy choices, progress updates, transformation steps, or performance direction in a visually direct way.
Q: Why do the 3D arrow metaphors help the audience understand the message faster?
A: The arrow shapes turn abstract business ideas into spatial cues: forward movement, upward growth, downward flow, and opposing forces. The blue highlight against gray supporting shapes creates a clear focal point, so the audience can quickly identify the main direction or priority before reading the supporting callout text.



3D Arrows Concept Charts for PowerPoint
9-slide PowerPoint presentation template with 3D arrow diagrams, comparison layouts, and timeline concepts
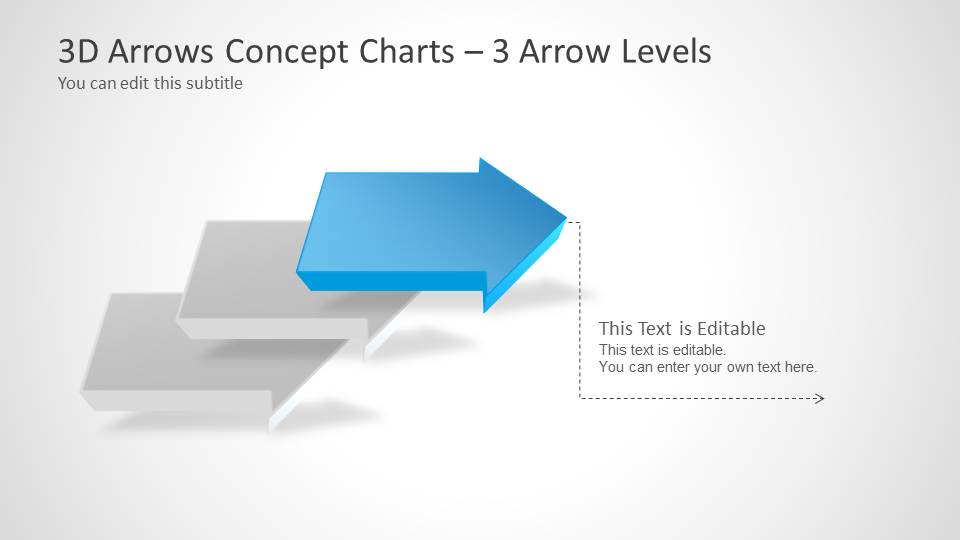
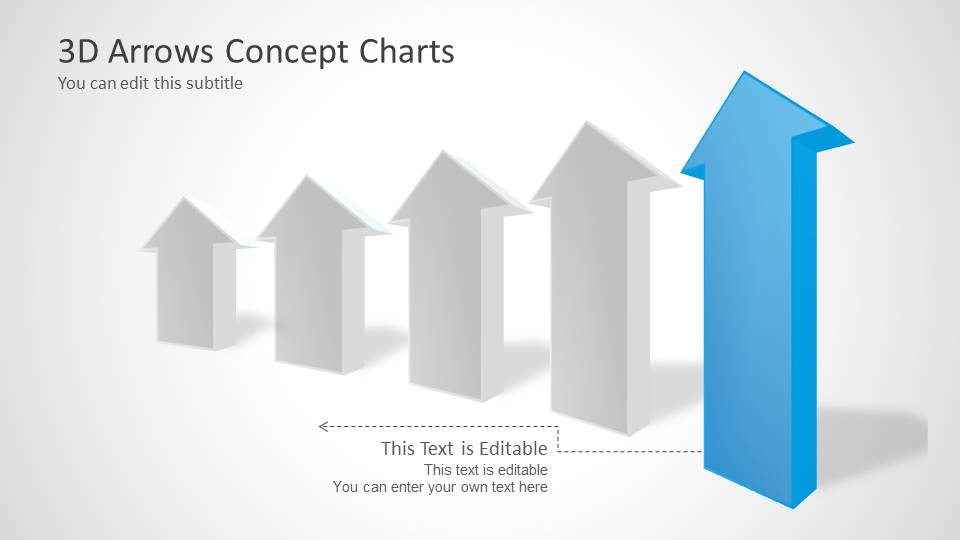
3D Arrows Concept Charts for PowerPoint is a 9-slide template built around editable 3D arrow graphics. It includes a title arrow, 3 arrow levels, four opposite arrows, a comparison layout, a timeline, and an up trend diagram for business presenters explaining direction, progress, contrast, or growth in PowerPoint.
- Rating


 Loading...
- Item ID
- 6021-3d
- Colors
 Microsoft PowerPoint
  Microsoft Copilot
  Claude for PowerPoint
 Other formats supported
Subscribe today and get immediate
access to download our PowerPoint templates.