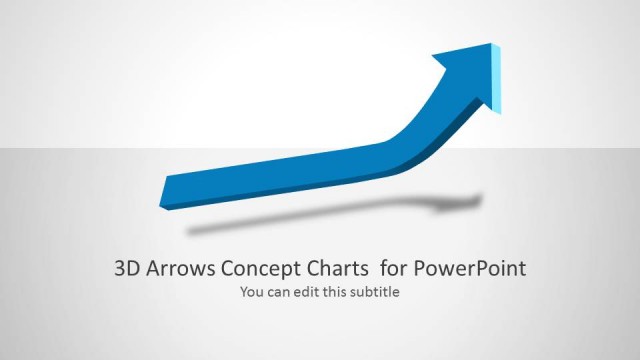
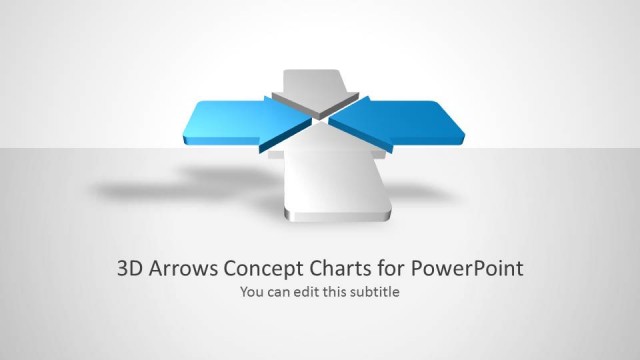
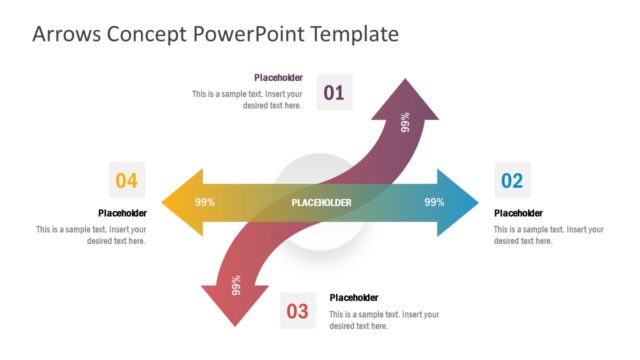
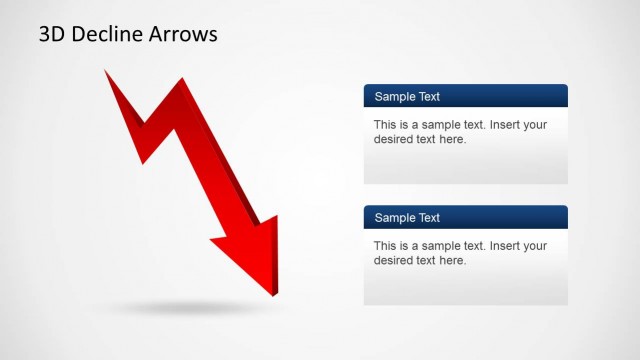
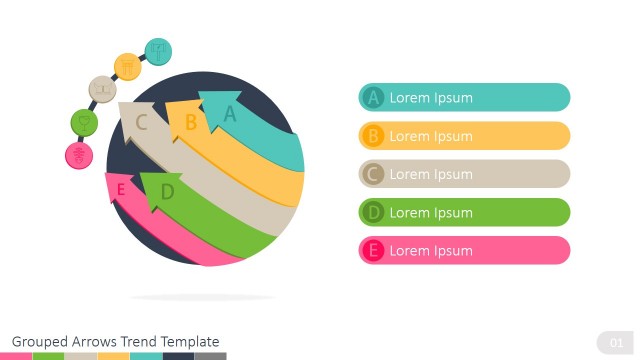
3D Arrow Progress Diagram Template for PowerPoint
3D Arrow Progress Diagram Template for PowerPoint is a presentation template containing nice arrow designs created with 3D special effects in PowerPoint. This template uses 3D graphics and arrows that can help you to prepare financial PowerPoint presentations as well as any other presentation requiring to show a progress or evolution using an increasing arrow metaphor.
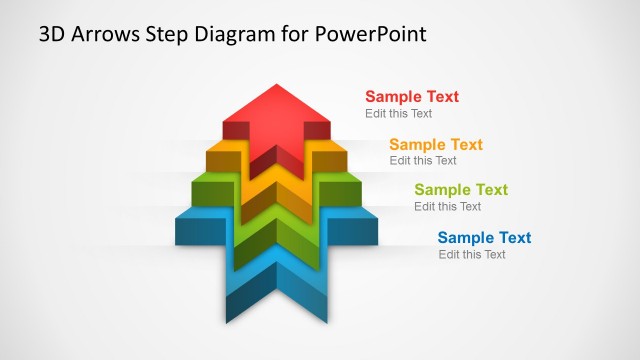
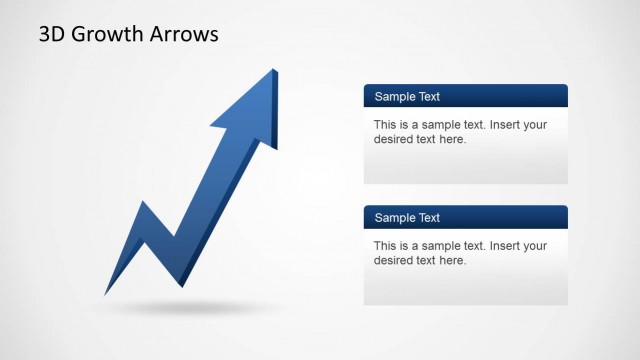
Every shape in this progress chart is created as PowerPoint objects, allowing the presenter to update and edit any feature and effect. Impress your audience and create outstanding PowerPoint Presentations that appeal to executive audiences.
You must be logged in to download this file.
DOWNLOADDetails (6 slides)
- Category
- Diagrams
- Rating


 Loading...
- Size
- 16x94x3
- Item ID
- 6486-01
- Colors
Supported Versions:
PowerPoint 2007PowerPoint 2010PowerPoint 2013PowerPoint 2011 MacPowerPoint 2016PowerPoint 2016 MacOffice 365
How to get this PowerPoint Template?
Subscribe today and get immediate
access to download our PowerPoint templates.