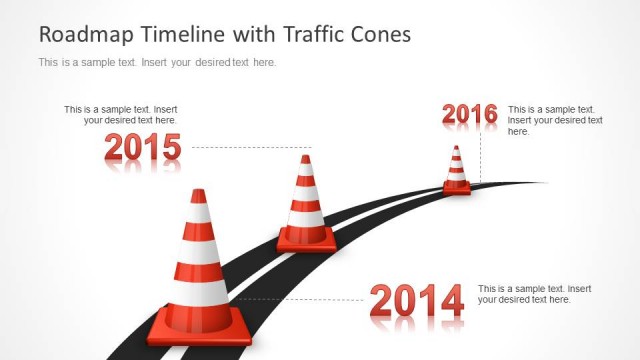
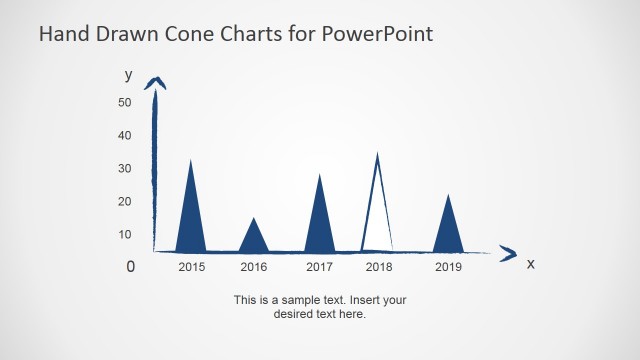
Traffic Cone shapes for PowerPoint can be used in project timelines to represent milestones and hurdles.
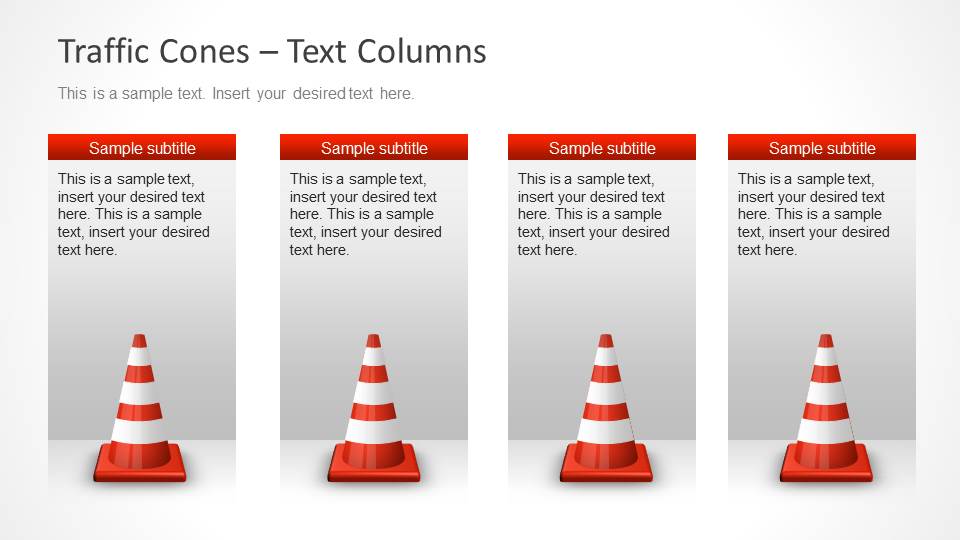
This presentation template contains several slide designs with traffic cone shapes that you can copy and paste into your PowerPoint presentations. Some useful layouts include four columns textboxes that you can edit with your own text. The traffic and construction cone shapes for PowerPoint can help you to make awesome slides with milestone metaphors.
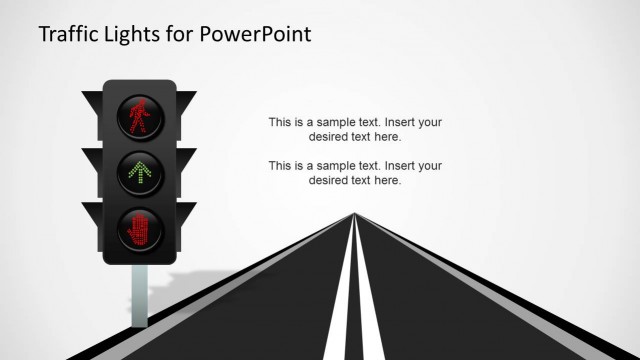
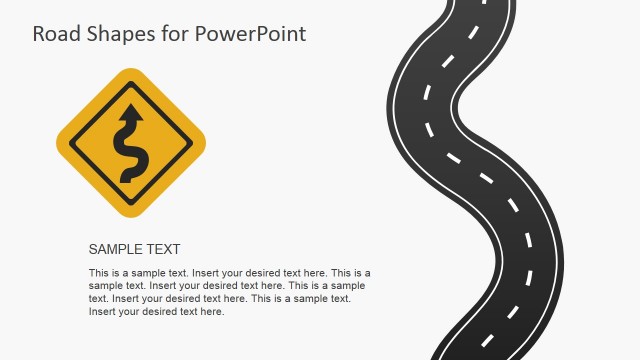
Alternatively, you can download other nice road signs & traffic lights and templates for PowerPoint presentations, including creative shapes that you can use in Microsoft PowerPoint and Google Slides.
What’s inside this template
Example presentation scenarios
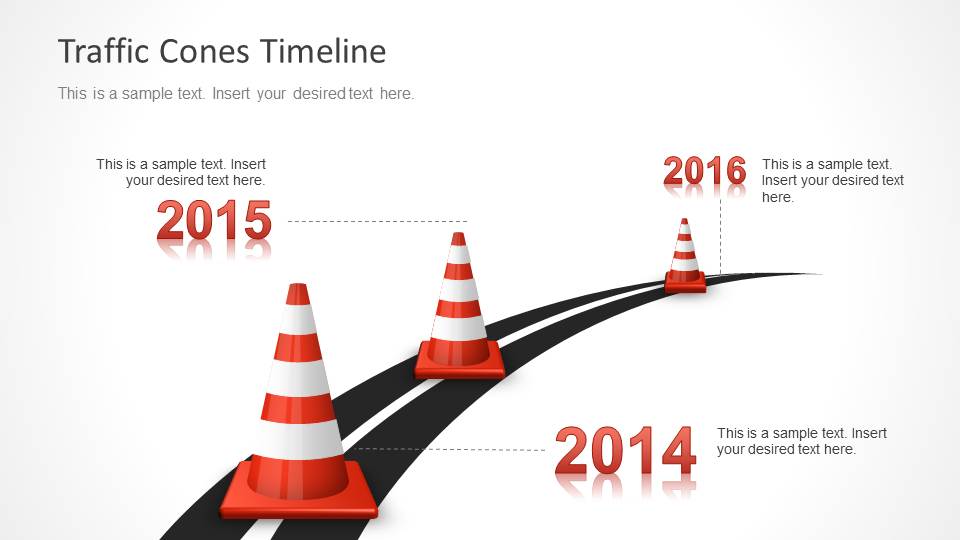
- A project manager can brief stakeholders on upcoming blockers by using the dated road timeline to show milestone sequence and caution points.
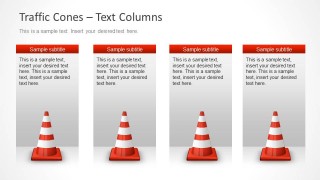
- A safety coordinator can introduce a construction or traffic control topic with the title slide and then use the four-column layout to list key precautions.
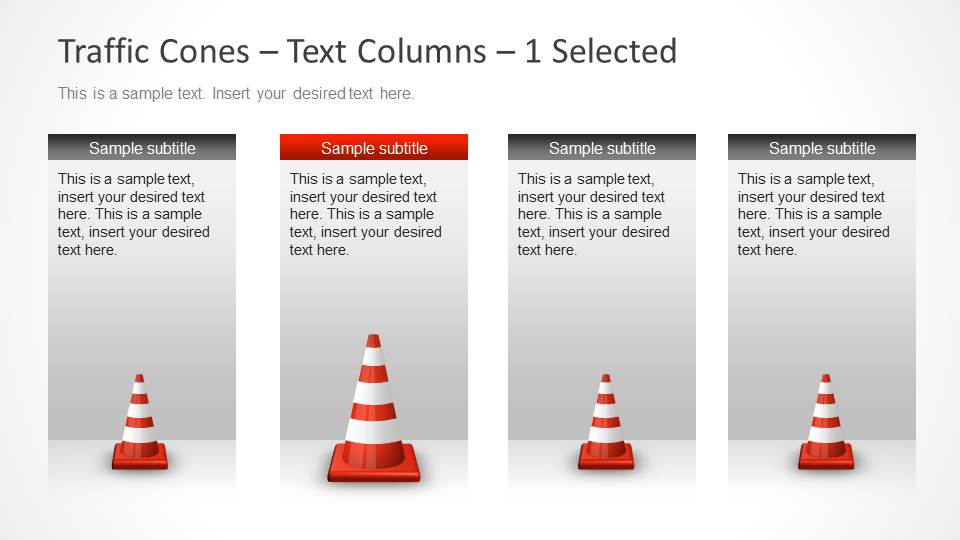
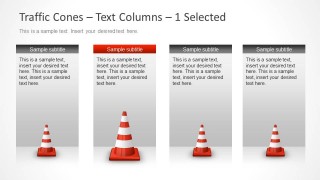
- An operations lead can compare four workstreams with the text-column slide and use the selected-column variation to spotlight the highest-risk area.
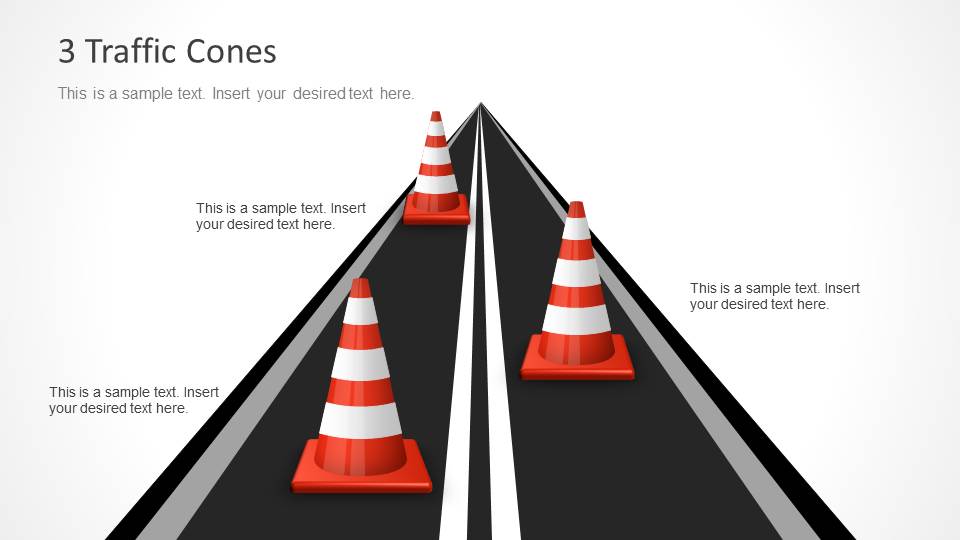
- A consultant can present a roadmap status update with the three-cone road diagram, assigning each cone to a priority, delay, or decision point.
Features
- 100% editable presentation template
- Compatible with Microsoft PowerPoint and Google Slides
- 16:9 aspect ratio slides
- Scalable vector shapes, icons and illustrations
- AI-Ready for Microsoft Copilot and Claude
- Instant access and download
Frequently asked questions
Q: How should I present milestones with the traffic cone timeline without making the slide feel like a warning sign?
A: Use the cone metaphor selectively. Place normal progress points in short text callouts, then reserve the largest cone or strongest red label for the issue that needs attention. On the dated timeline, keep each callout to one clear decision, delay, or checkpoint so the audience reads the road as progress, not only as danger.
Q: Who is this traffic cone shape template best suited for?
A: This template fits presenters who need a visual way to discuss obstacles, safety steps, construction updates, or implementation checkpoints. Project managers, operations leads, and safety coordinators can use the four-column slide for categories and the road diagram for priority areas when a standard bullet list would make the message easy to ignore.
Q: Why does the road and traffic cone metaphor work for business updates?
A: Traffic cones are immediately understood as markers for caution, work in progress, or temporary disruption. The road graphics add direction, so the audience sees the topic as a journey with checkpoints rather than a static warning. This visual metaphor is useful when the speaker must show both movement and controlled risk.



Traffic Cone Shapes for PowerPoint
5-slide presentation template with traffic cone shapes, timeline milestones, and road caution metaphors
Traffic Cone Shapes for PowerPoint is a 5-slide, 16:9 shapes template for adding construction cone metaphors to project and safety presentations. It includes a road title slide, four-column text layouts, a selected-column comparison, a dated timeline, and a three-cone road diagram for milestones, risks, or blockers in Microsoft PowerPoint and Google Slides.
- Category
- Shapes
- Rating


 Loading...
- Aspect ratio
- 16:9
- Item ID
- 6112-05
- Colors
 Microsoft PowerPoint
  Microsoft Copilot
  Claude for PowerPoint
 Other formats supported
Subscribe today and get immediate
access to download our PowerPoint templates.