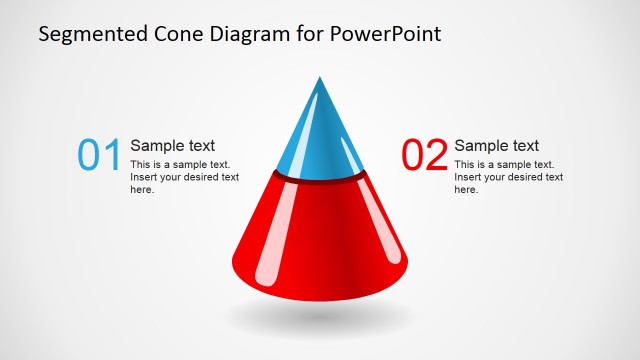
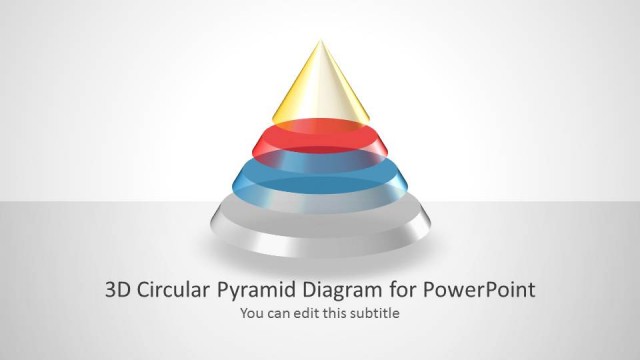
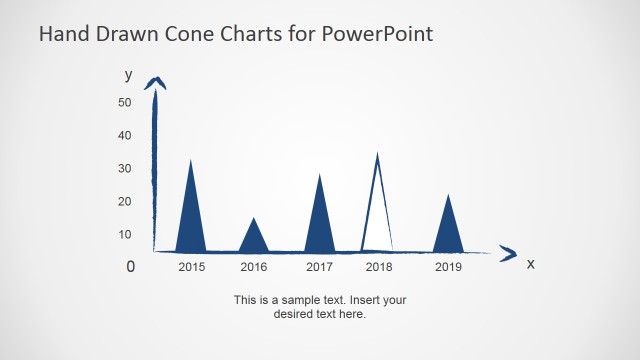
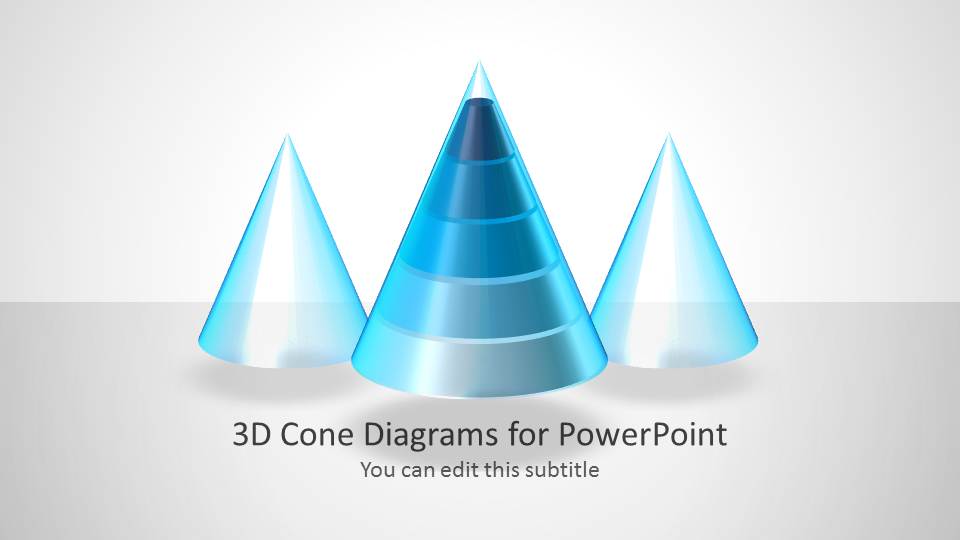
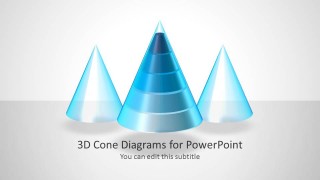
3D Cone Diagrams for PowerPoint is a presentation template containing 3D cones and cone shapes ready to be used in PowerPoint presentations.
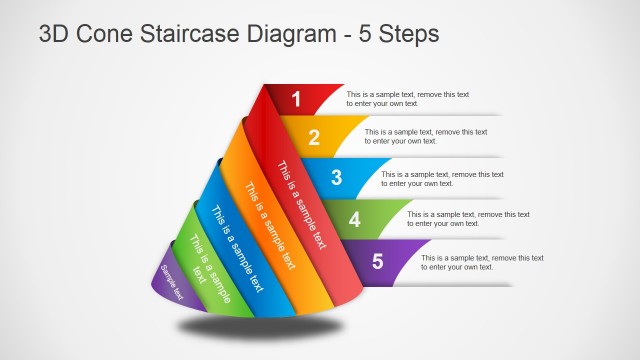
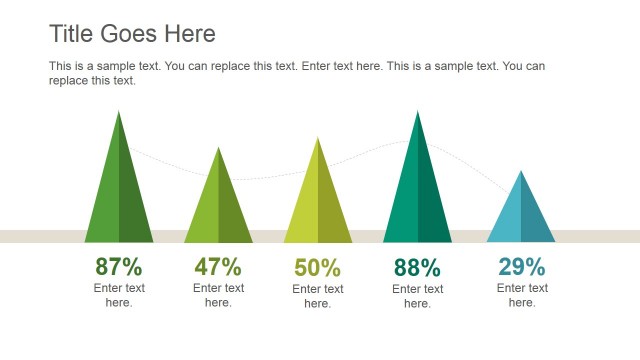
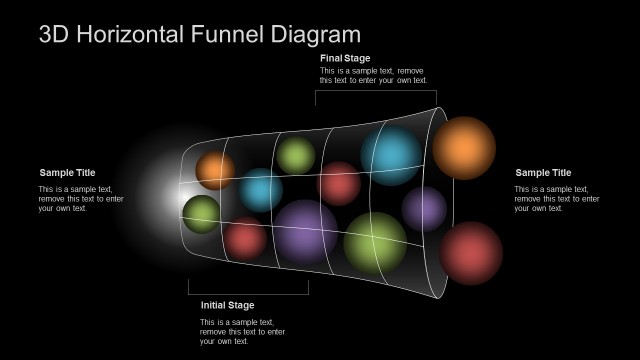
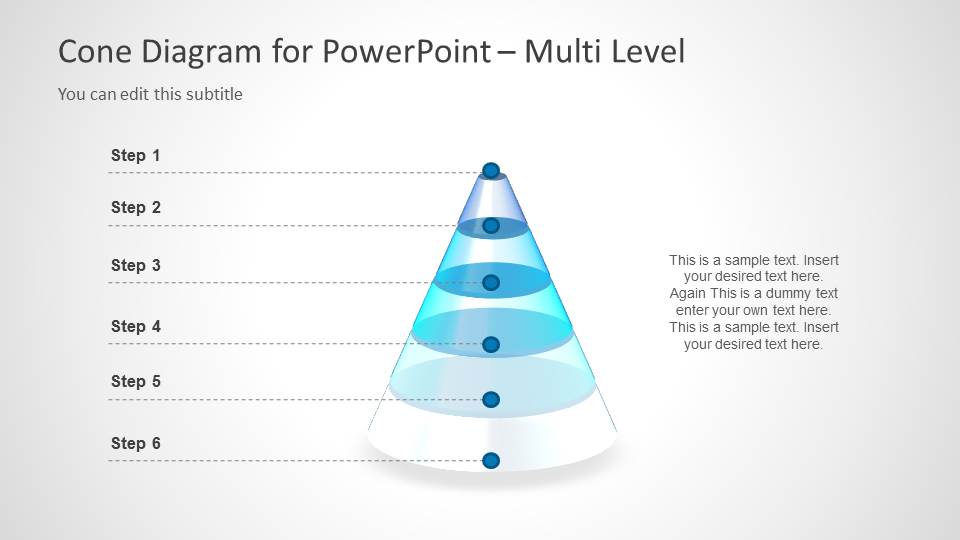
The seven slide designs inside this PPT template can help to prepare awesome diagrams using 3D cones with an awesome glossy effect. You can use the slides with 3D cone diagrams to present challenges and hurdles in a PowerPoint slide show a hierarchical process of up to 5-steps.
This presentation template with cone diagrams for PowerPoint comes with editable fields so you can enter your own text. You can also modify the layout and shape using PowerPoint shapes feature.
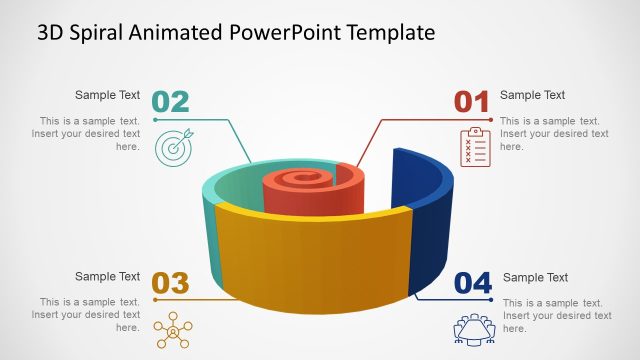
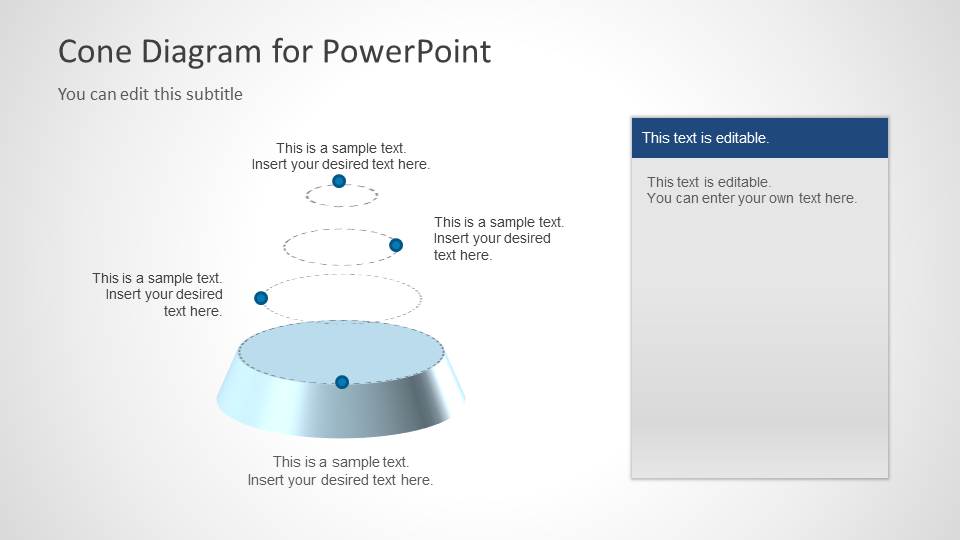
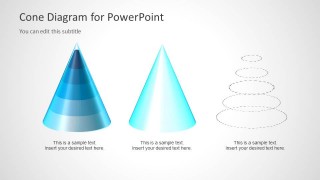
One of the slides contains a nice spiral effect following the same path used for the cone. You can use this spiral diagram to represent a spiral model useful for risk-driven process used for software projects and software development. The spiral model guides a team to adopt elements of one or more process models, such as incremental, waterfall, or evolutionary prototyping.
What’s inside this template
Example presentation scenarios
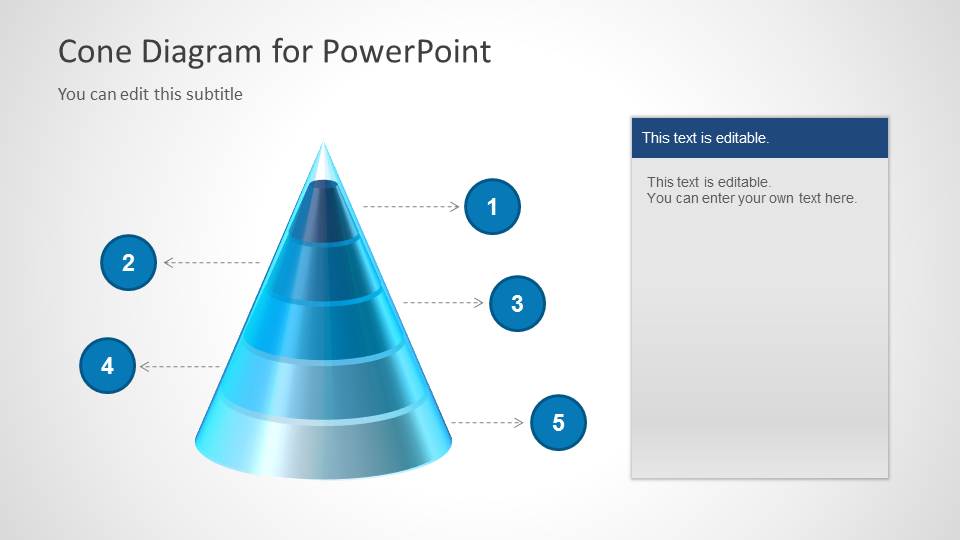
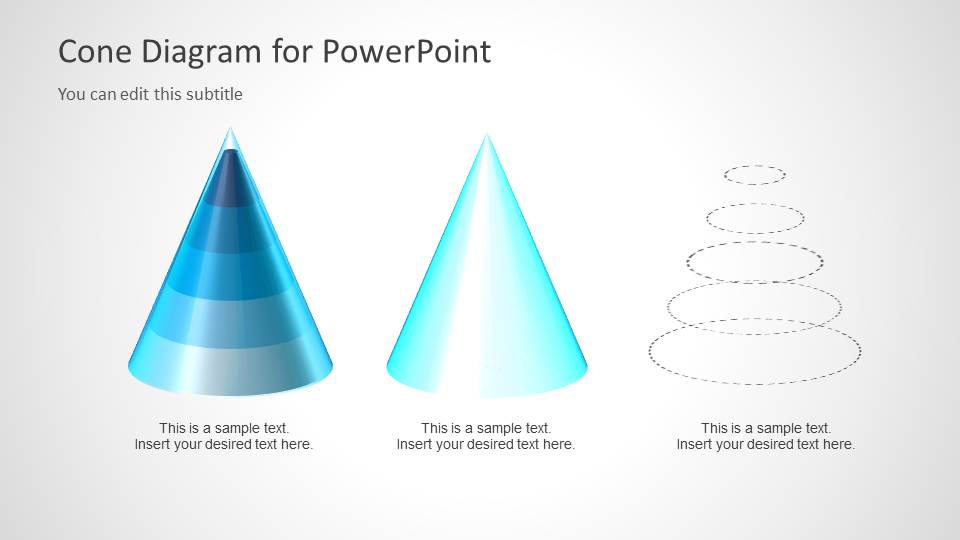
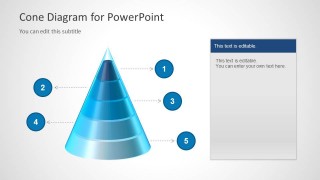
- A consultant can use the five-segment cone with numbered callouts to explain a maturity model, with each cone band representing a level the client must understand.
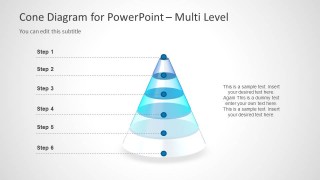
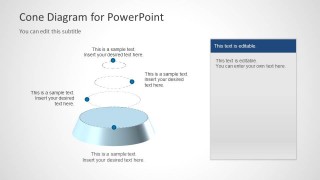
- A project manager can use the multi-level step cone to present milestones, barriers, or escalation stages during a process planning meeting.
- A software team lead can use the spiral cone model to describe iterative development, risk review, or repeating decision cycles to stakeholders.
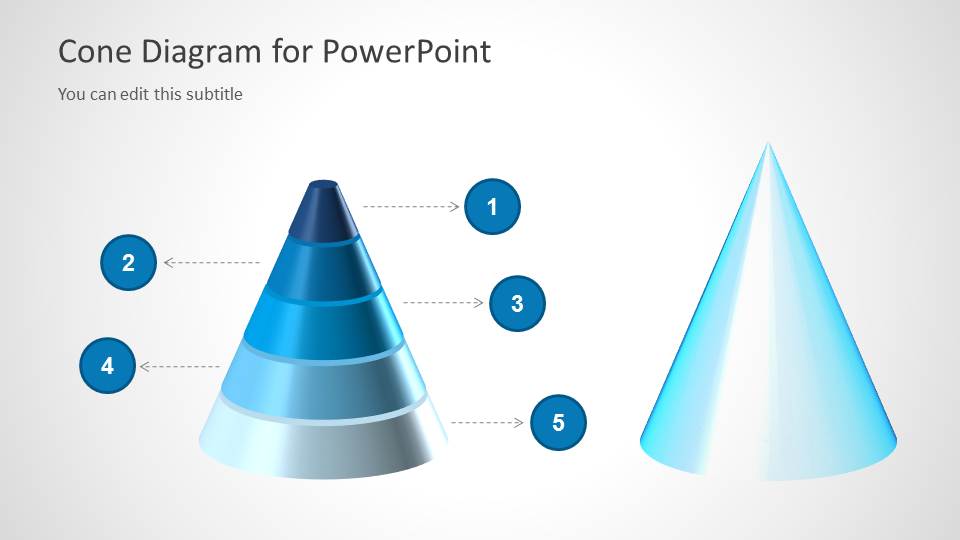
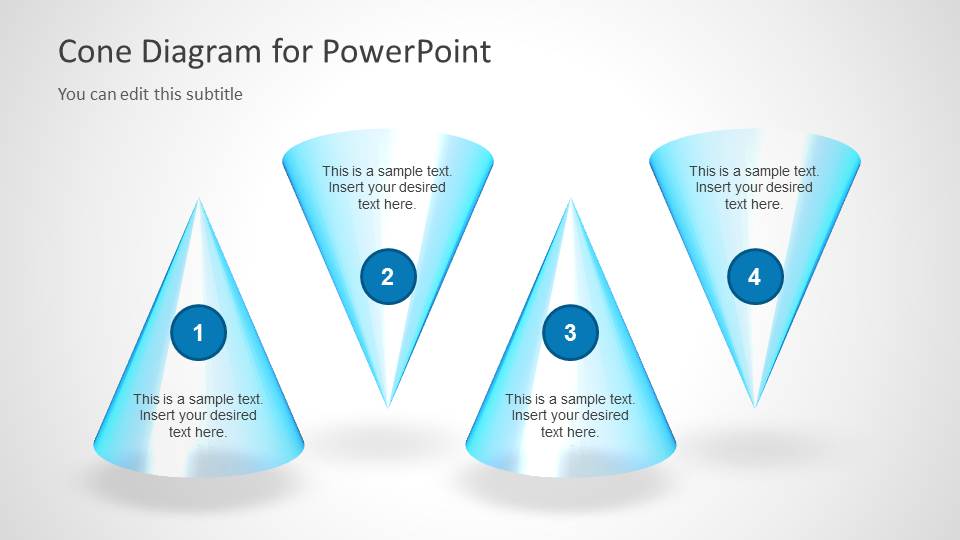
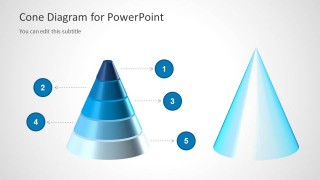
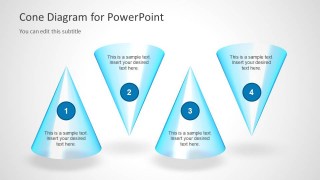
- A trainer can use the four-cone process slide to compare stages in a learning path, asking learners to focus on one numbered cone at a time.
Features
- 100% editable presentation template
- Compatible with Microsoft PowerPoint and Google Slides
- 16:9 aspect ratio slides
- Scalable vector shapes, icons and illustrations
- AI-Ready for Microsoft Copilot and Claude
- Instant access and download
Frequently asked questions
Q: How should a presenter explain a cone diagram without making it feel decorative?
A: Start by assigning meaning to the cone shape before discussing the labels. For example, define whether the narrow top means priority, maturity, scarcity, or final outcome. Then use the numbered callouts or step labels to move from level to level, so the 3D visual supports the logic instead of becoming background decoration.
Q: Who is this template best suited for in a business presentation?
A: This template fits presenters who need to explain layered or staged ideas rather than detailed data. Consultants, project managers, trainers, and software leads can use the segmented cone, multi-level step cone, and spiral model to show maturity levels, implementation stages, process barriers, or iterative development paths in a visual format.
Q: Why use cone and spiral metaphors for process communication?
A: The cone metaphor gives audiences an immediate sense of narrowing, stacking, or progression toward a point. The spiral version adds motion and repetition, which is useful for iterative or risk-driven models. These visual metaphors reduce the need for long text blocks and help viewers compare levels, loops, and stages quickly.
3D Cone Diagrams for PowerPoint
7-slide presentation template with 3D cone funnels, step hierarchy, and spiral process diagrams
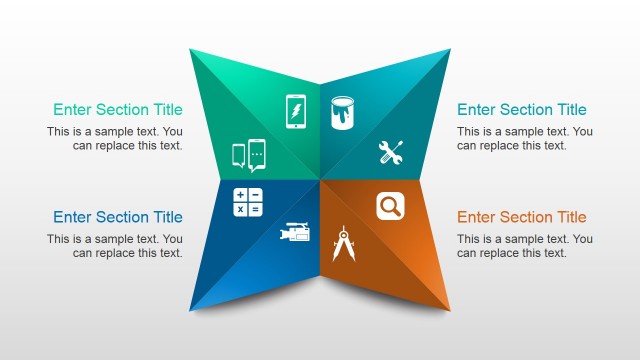
3D Cone Diagrams for PowerPoint is a 7-slide diagram template for showing hierarchy, staged progress, and funnel-like structures. Visible layouts include a five-segment cone with numbered callouts, a multi-level step cone, alternating cone process options, and a spiral model. It is for business, project, and training presentations in Microsoft PowerPoint and Google Slides.
- Category
- Diagrams
- Rating

 Loading...
- Aspect ratio
- 16:9
- Item ID
- 6089-01
- Colors
 Microsoft PowerPoint
 Microsoft Copilot
 Claude for PowerPoint
Other formats supported
Subscribe today and get immediate
access to download our PowerPoint templates.