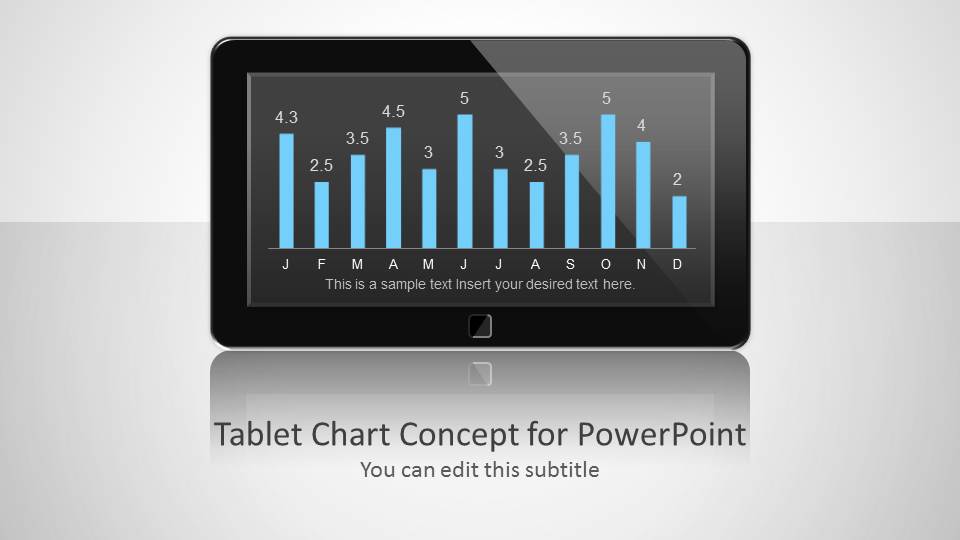
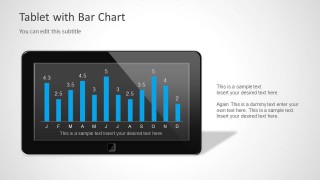
Tablet Chart Concept for PowerPoint is a nice presentation template with a tablet design and blue bar chart. You can use this blue bar chart design with tablet placeholder to grab the audience attention. The chart can easily be changed to any other chart type, for example to show the pie chart inside the tablet illustration.
You can use the tablet placeholder with a blue bar chart inside to make a more relevant PowerPoint presentations in a given context.
What’s inside this template
Example presentation scenarios
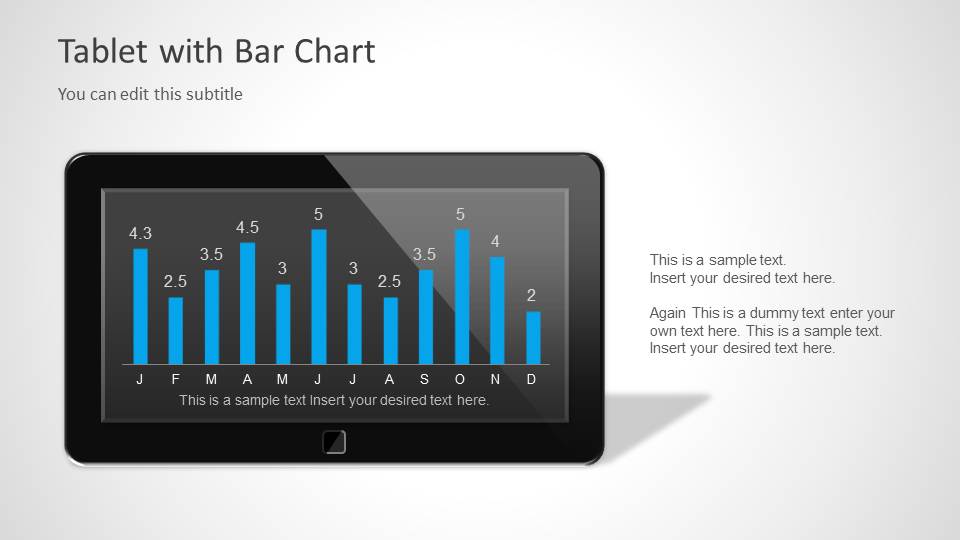
- A product manager can use the tablet-framed bar chart to show monthly app engagement or feature usage while keeping the discussion visually tied to a mobile product.
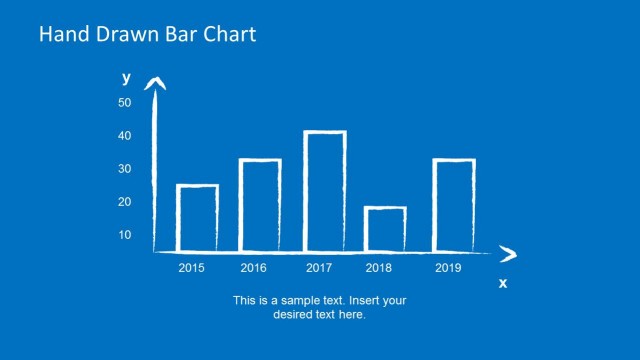
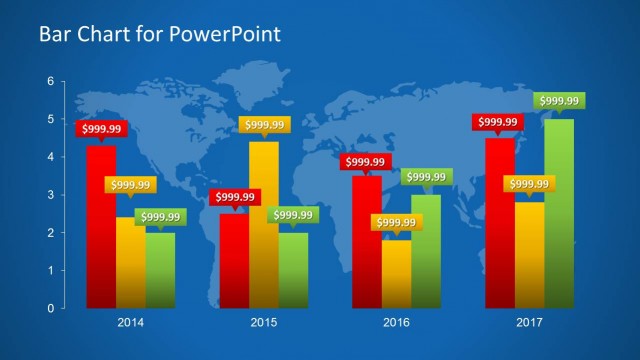
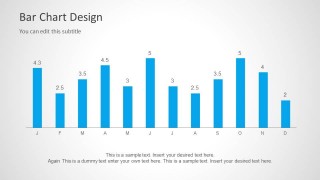
- A marketing analyst can use the standalone bar chart to compare monthly campaign results and add a short interpretation below the chart for executive readers.
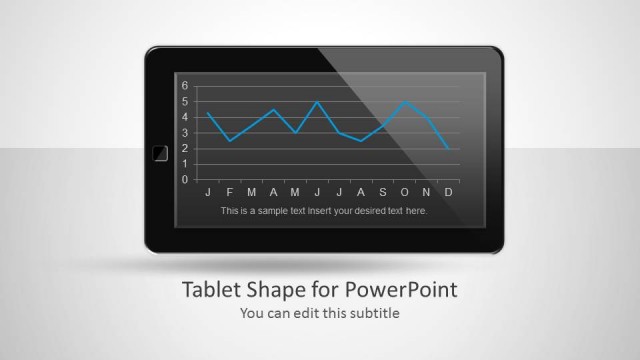
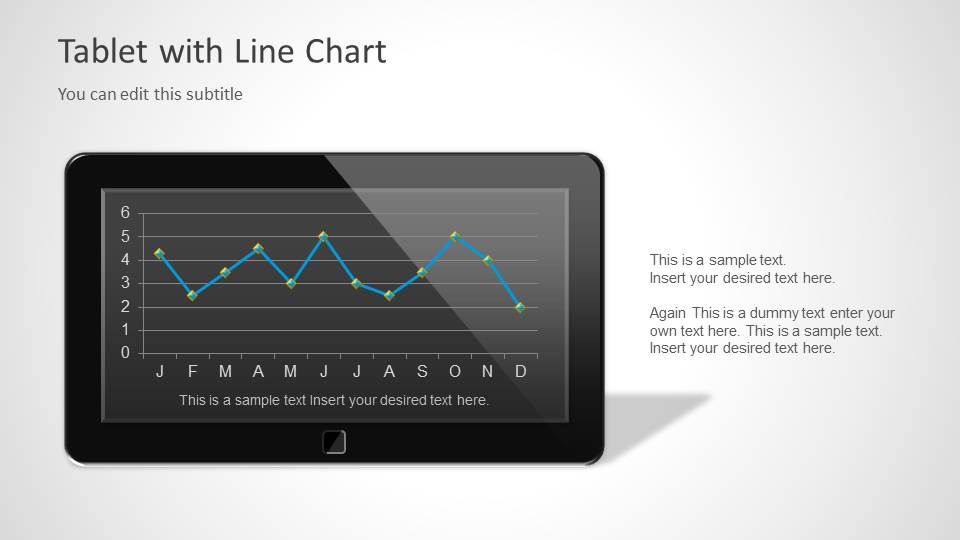
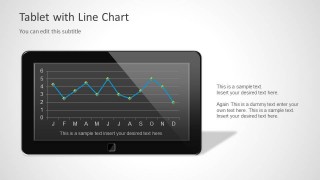
- A startup founder can use the tablet-framed line chart to explain traction trends in a pitch section focused on digital adoption or user growth.
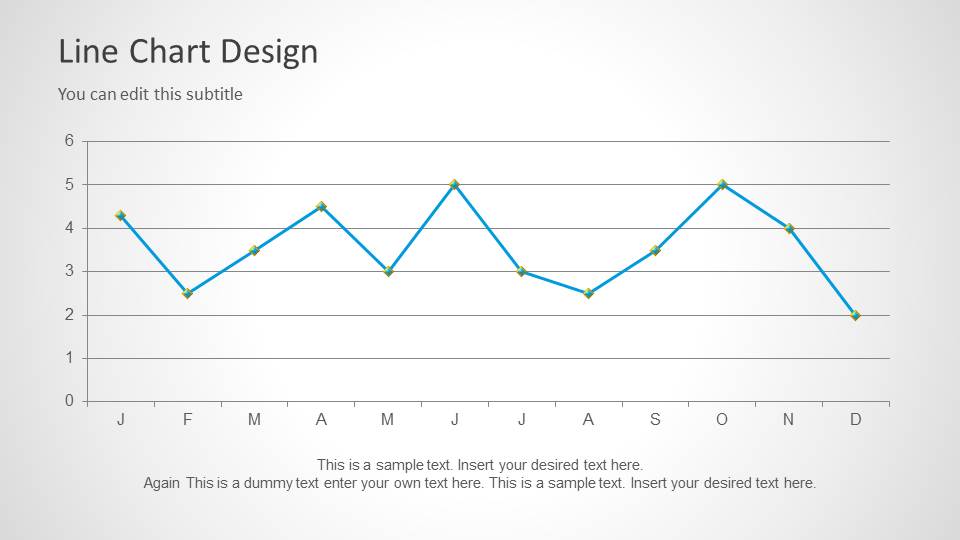
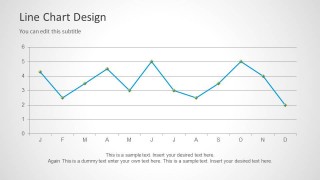
- A technology consultant can use the full-slide line chart to report progress over time and discuss where performance rose, dropped, or stabilized.
Features
- 100% editable presentation template
- Compatible with Microsoft PowerPoint and Google Slides
- Scalable vector shapes, icons and illustrations
- AI-Ready for Microsoft Copilot and Claude
- Instant access and download
Frequently asked questions
Q: How should a presenter explain the chart message without letting the tablet graphic distract from the data?
A: Use the tablet frame as context, then direct attention to one takeaway in the title or right-side text. For the tablet bar and line chart slides, state the main change first, then reference only the most relevant months or peaks. Keep the device visual as a cue for mobile or digital relevance, not as the main point.
Q: Who is this template best suited for in a business presentation?
A: This template fits presenters who need to report product, app, or technology metrics in a compact chart section. Product managers, analysts, consultants, and founders can use the bar chart to compare periods and the line chart to explain a trend. It works best when the data has a clear monthly pattern or short performance story.
Q: Why use both tablet-framed charts and standalone chart slides?
A: The tablet-framed slides create a visual metaphor for mobile and digital performance, while the standalone chart slides remove the device frame when the audience needs a cleaner data view. This sequence lets a presenter open with context, then shift to clearer comparison and trend reading without changing the chart language.


Tablet Chart Concept for PowerPoint with Blue Style
5-slide PowerPoint presentation template for tablet-framed bar and line charts with blue technology styling
Tablet Chart Concept for PowerPoint with Blue Style is a 5-slide PowerPoint template for presenting metrics in a mobile device visual. It includes a title cover, tablet-framed bar chart, standalone bar chart, tablet-framed line chart, and standalone line chart for technology reports, app metrics, and monthly performance updates. Chart data can be edited as an Excel spreadsheet in PowerPoint.


 Loading...
 Microsoft PowerPoint
  Microsoft Copilot
  Claude for PowerPoint
 Other formats supported
Subscribe today and get immediate
access to download our PowerPoint templates.